

It implies the calculation of the correlation factor, mostly the linear factor, that is
represented by the gradient of the red line in Fig. 5.2. Consequently, a calibration is
only valid in the linearity range of the detector.
General Note
Since the response factor is unique for an analytical system and an analyte,
calibration needs to be performed for each system and each analyte
individually.
Signal intensity
ideal peak
(symmetric)
fronting
tailing
Retention time
increasing tailing
full overlap
only partly separated
(A)
(C)
(B)
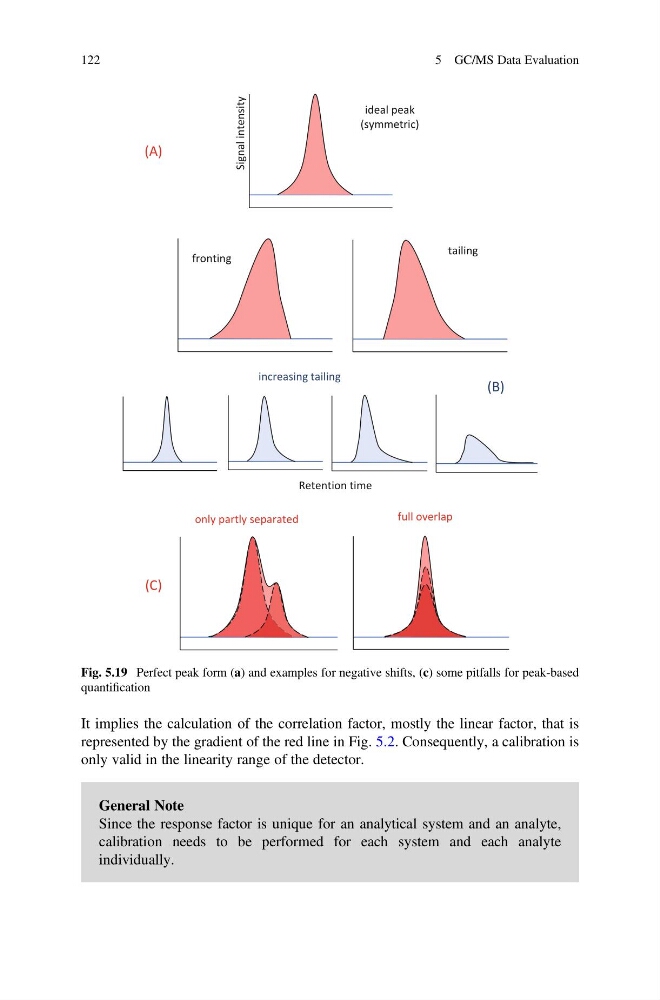
Fig. 5.19 Perfect peak form (a) and examples for negative shifts, (c) some pitfalls for peak-based
quantification
122
5 GC/MS Data Evaluation
represented by the gradient of the red line in Fig. 5.2. Consequently, a calibration is
only valid in the linearity range of the detector.
General Note
Since the response factor is unique for an analytical system and an analyte,
calibration needs to be performed for each system and each analyte
individually.
Signal intensity
ideal peak
(symmetric)
fronting
tailing
Retention time
increasing tailing
full overlap
only partly separated
(A)
(C)
(B)
Fig. 5.19 Perfect peak form (a) and examples for negative shifts, (c) some pitfalls for peak-based
quantification
122
5 GC/MS Data Evaluation