

amount, normally a linear correlation. This relation allows to link detected signals
but also peaks and quantitative data. In chromatography (GC as well as LC) two
main features of a peak can be used for quantitation, the peak height and the peak
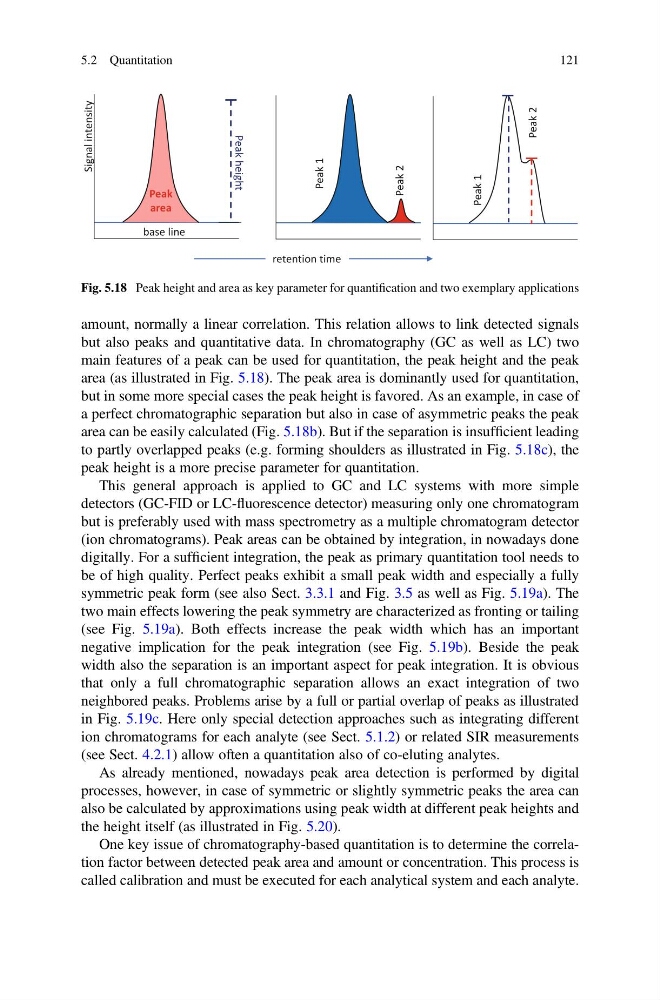
area (as illustrated in Fig. 5.18). The peak area is dominantly used for quantitation,
but in some more special cases the peak height is favored. As an example, in case of
a perfect chromatographic separation but also in case of asymmetric peaks the peak
area can be easily calculated (Fig. 5.18b). But if the separation is insufficient leading
to partly overlapped peaks (e.g. forming shoulders as illustrated in Fig. 5.18c), the
peak height is a more precise parameter for quantitation.
This general approach is applied to GC and LC systems with more simple
detectors (GC-FID or LC-fluorescence detector) measuring only one chromatogram
but is preferably used with mass spectrometry as a multiple chromatogram detector
(ion chromatograms). Peak areas can be obtained by integration, in nowadays done
digitally. For a sufficient integration, the peak as primary quantitation tool needs to
be of high quality. Perfect peaks exhibit a small peak width and especially a fully
symmetric peak form (see also Sect. 3.3.1 and Fig. 3.5 as well as Fig. 5.19a). The
two main effects lowering the peak symmetry are characterized as fronting or tailing
(see Fig. 5.19a). Both effects increase the peak width which has an important
negative implication for the peak integration (see Fig. 5.19b). Beside the peak
width also the separation is an important aspect for peak integration. It is obvious
that only a full chromatographic separation allows an exact integration of two
neighbored peaks. Problems arise by a full or partial overlap of peaks as illustrated
in Fig. 5.19c. Here only special detection approaches such as integrating different
ion chromatograms for each analyte (see Sect. 5.1.2) or related SIR measurements
(see Sect. 4.2.1) allow often a quantitation also of co-eluting analytes.
As already mentioned, nowadays peak area detection is performed by digital
processes, however, in case of symmetric or slightly symmetric peaks the area can
also be calculated by approximations using peak width at different peak heights and
the height itself (as illustrated in Fig. 5.20).
One key issue of chromatography-based quantitation is to determine the correlation factor between detected peak area and amount or concentration. This process is
called calibration and must be executed for each analytical system and each analyte.
Peak
area
Peak height
retention time
y
t
i
s
n
e
t
n
i
l
a
n
g
i
S
base line
Peak 1
Peak 2
Peak 1
Peak 2
Fig. 5.18 Peak height and area as key parameter for quantification and two exemplary applications
5.2 Quantitation
121
but also peaks and quantitative data. In chromatography (GC as well as LC) two
main features of a peak can be used for quantitation, the peak height and the peak
area (as illustrated in Fig. 5.18). The peak area is dominantly used for quantitation,
but in some more special cases the peak height is favored. As an example, in case of
a perfect chromatographic separation but also in case of asymmetric peaks the peak
area can be easily calculated (Fig. 5.18b). But if the separation is insufficient leading
to partly overlapped peaks (e.g. forming shoulders as illustrated in Fig. 5.18c), the
peak height is a more precise parameter for quantitation.
This general approach is applied to GC and LC systems with more simple
detectors (GC-FID or LC-fluorescence detector) measuring only one chromatogram
but is preferably used with mass spectrometry as a multiple chromatogram detector
(ion chromatograms). Peak areas can be obtained by integration, in nowadays done
digitally. For a sufficient integration, the peak as primary quantitation tool needs to
be of high quality. Perfect peaks exhibit a small peak width and especially a fully
symmetric peak form (see also Sect. 3.3.1 and Fig. 3.5 as well as Fig. 5.19a). The
two main effects lowering the peak symmetry are characterized as fronting or tailing
(see Fig. 5.19a). Both effects increase the peak width which has an important
negative implication for the peak integration (see Fig. 5.19b). Beside the peak
width also the separation is an important aspect for peak integration. It is obvious
that only a full chromatographic separation allows an exact integration of two
neighbored peaks. Problems arise by a full or partial overlap of peaks as illustrated
in Fig. 5.19c. Here only special detection approaches such as integrating different
ion chromatograms for each analyte (see Sect. 5.1.2) or related SIR measurements
(see Sect. 4.2.1) allow often a quantitation also of co-eluting analytes.
As already mentioned, nowadays peak area detection is performed by digital
processes, however, in case of symmetric or slightly symmetric peaks the area can
also be calculated by approximations using peak width at different peak heights and
the height itself (as illustrated in Fig. 5.20).
One key issue of chromatography-based quantitation is to determine the correlation factor between detected peak area and amount or concentration. This process is
called calibration and must be executed for each analytical system and each analyte.
Peak
area
Peak height
retention time
y
t
i
s
n
e
t
n
i
l
a
n
g
i
S
base line
Peak 1
Peak 2
Peak 1
Peak 2
Fig. 5.18 Peak height and area as key parameter for quantification and two exemplary applications
5.2 Quantitation
121