

30
210
200
160
180
m/z
191
206
9-ethylphenanthren
-15
relative intensity
170
190
150
140
130
120
110
100
90
70
50
40
60
80
150
190
180
170
160
140
130
120
110
100
90
80
70
60
50
40
30
192
m/z
9-methylphenanthrene
relative intensity
80
60
150
190
170
-15
206
191
m/z
2,5-dimethylphenanthrene
relative intensity
30 40 50
70
90 100 110 120 130 140
160
180
200 210
40
30
60
50
70
90 100
140
120
150
170
210
190
220
250
240
270
290
310
130
160
191
304
m/z
9-nonylphenanthrene
-113
relative intensity
260
300
280
180
110
200
230
80
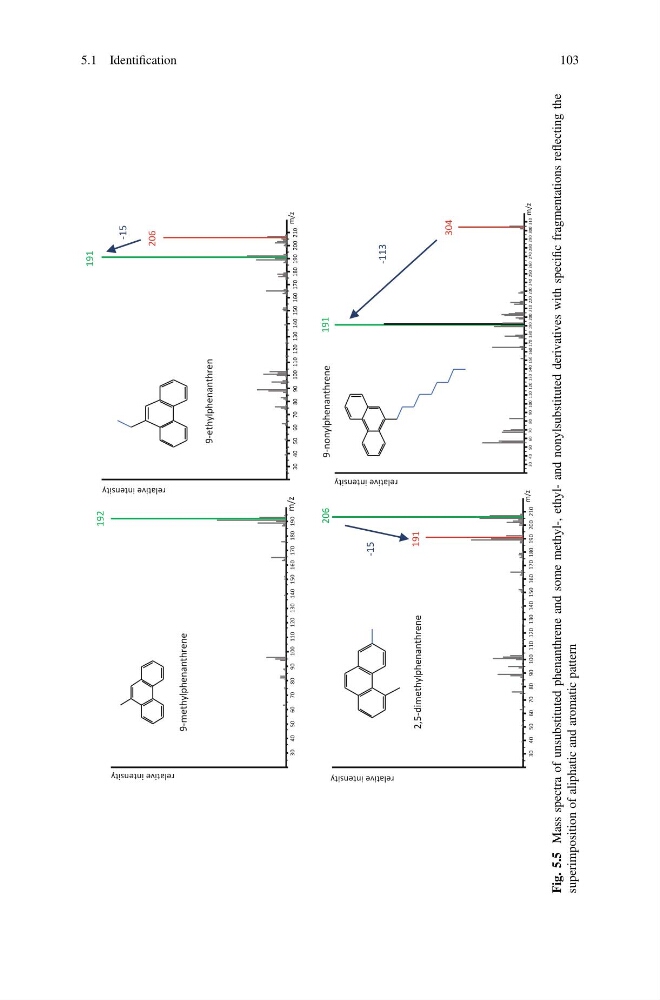
Fig. 5.5
Mass spectra of unsubstituted phenanthrene and some methyl-, ethyl- and nonylsubstituted derivatives with specific fragmentations reflecting the
superimposition of aliphatic and aromatic pattern
5.1 Identification
103
210
200
160
180
m/z
191
206
9-ethylphenanthren
-15
relative intensity
170
190
150
140
130
120
110
100
90
70
50
40
60
80
150
190
180
170
160
140
130
120
110
100
90
80
70
60
50
40
30
192
m/z
9-methylphenanthrene
relative intensity
80
60
150
190
170
-15
206
191
m/z
2,5-dimethylphenanthrene
relative intensity
30 40 50
70
90 100 110 120 130 140
160
180
200 210
40
30
60
50
70
90 100
140
120
150
170
210
190
220
250
240
270
290
310
130
160
191
304
m/z
9-nonylphenanthrene
-113
relative intensity
260
300
280
180
110
200
230
80
Fig. 5.5
Mass spectra of unsubstituted phenanthrene and some methyl-, ethyl- and nonylsubstituted derivatives with specific fragmentations reflecting the
superimposition of aliphatic and aromatic pattern
5.1 Identification
103