

Fast Reverse Replays in a Robotic Hippocampal Model
395
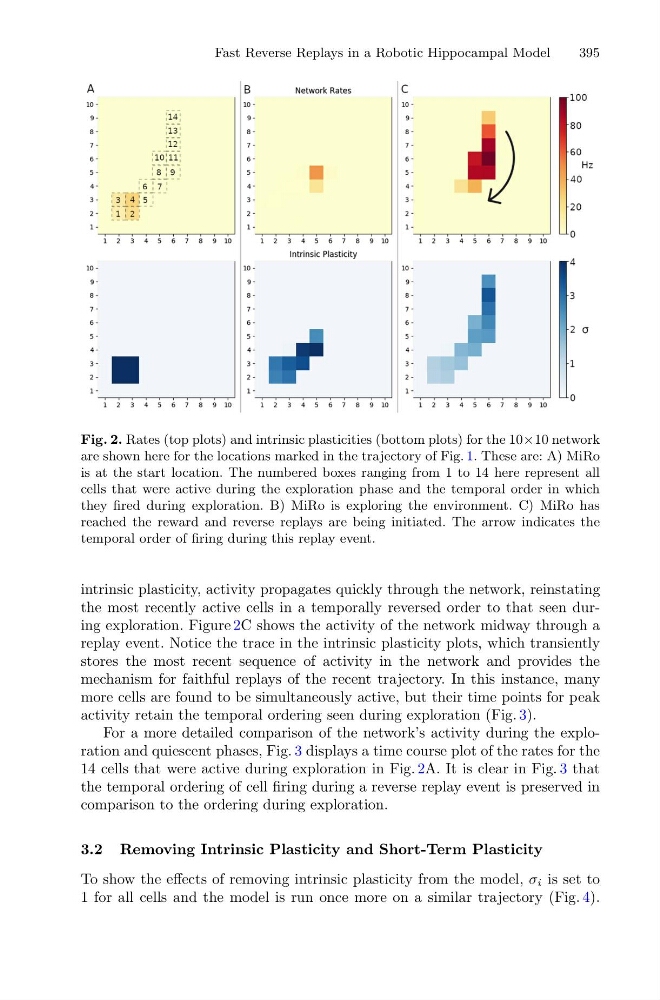
Fig. 2. Rates (top plots) and intrinsic plasticities (bottom plots) for the 10×10 network
are shown here for the locations marked in the trajectory of Fig. 1. These are: A) MiRo
is at the start location. The numbered boxes ranging from 1 to 14 here represent all
cells that were active during the exploration phase and the temporal order in which
they fired during exploration. B) MiRo is exploring the environment. C) MiRo has
reached the reward and reverse replays are being initiated. The arrow indicates the
temporal order of firing during this replay event.
intrinsic plasticity, activity propagates quickly through the network, reinstating
the most recently active cells in a temporally reversed order to that seen during exploration. Figure 2C shows the activity of the network midway through a
replay event. Notice the trace in the intrinsic plasticity plots, which transiently
stores the most recent sequence of activity in the network and provides the
mechanism for faithful replays of the recent trajectory. In this instance, many
more cells are found to be simultaneously active, but their time points for peak
activity retain the temporal ordering seen during exploration (Fig. 3).
For a more detailed comparison of the network’s activity during the exploration and quiescent phases, Fig. 3 displays a time course plot of the rates for the
14 cells that were active during exploration in Fig. 2A. It is clear in Fig. 3 that
the temporal ordering of cell firing during a reverse replay event is preserved in
comparison to the ordering during exploration.
3.2 Removing Intrinsic Plasticity and Short-Term Plasticity
To show the effects of removing intrinsic plasticity from the model, σ i is set to
1 for all cells and the model is run once more on a similar trajectory (Fig. 4).
395
Fig. 2. Rates (top plots) and intrinsic plasticities (bottom plots) for the 10×10 network
are shown here for the locations marked in the trajectory of Fig. 1. These are: A) MiRo
is at the start location. The numbered boxes ranging from 1 to 14 here represent all
cells that were active during the exploration phase and the temporal order in which
they fired during exploration. B) MiRo is exploring the environment. C) MiRo has
reached the reward and reverse replays are being initiated. The arrow indicates the
temporal order of firing during this replay event.
intrinsic plasticity, activity propagates quickly through the network, reinstating
the most recently active cells in a temporally reversed order to that seen during exploration. Figure 2C shows the activity of the network midway through a
replay event. Notice the trace in the intrinsic plasticity plots, which transiently
stores the most recent sequence of activity in the network and provides the
mechanism for faithful replays of the recent trajectory. In this instance, many
more cells are found to be simultaneously active, but their time points for peak
activity retain the temporal ordering seen during exploration (Fig. 3).
For a more detailed comparison of the network’s activity during the exploration and quiescent phases, Fig. 3 displays a time course plot of the rates for the
14 cells that were active during exploration in Fig. 2A. It is clear in Fig. 3 that
the temporal ordering of cell firing during a reverse replay event is preserved in
comparison to the ordering during exploration.
3.2 Removing Intrinsic Plasticity and Short-Term Plasticity
To show the effects of removing intrinsic plasticity from the model, σ i is set to
1 for all cells and the model is run once more on a similar trajectory (Fig. 4).