

358
A. Thoma et al.
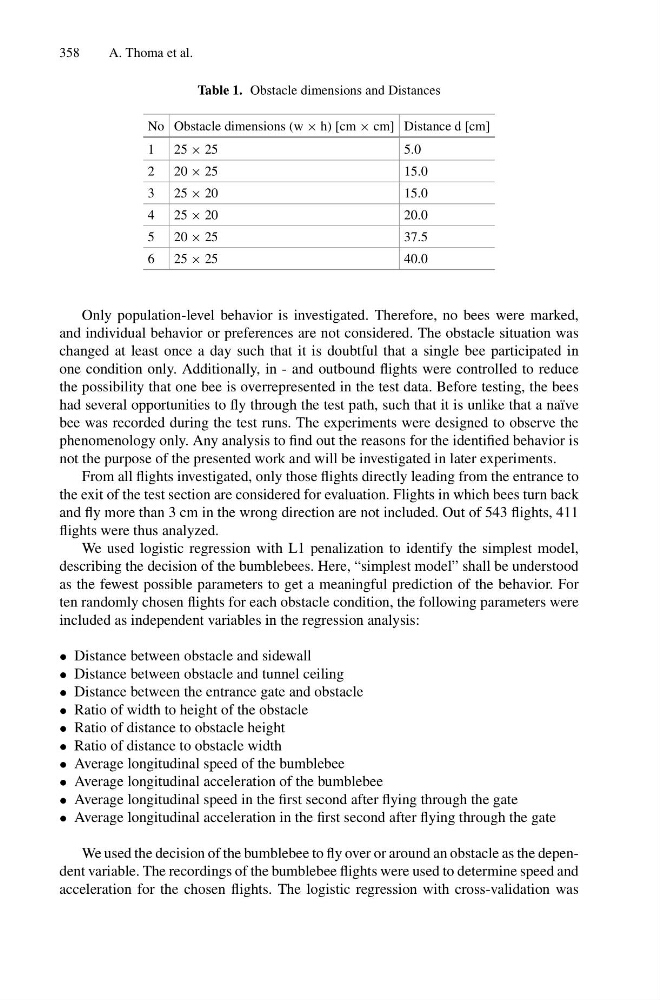
Table 1. Obstacle dimensions and Distances
No Obstacle dimensions (w × h) [cm × cm] Distance d [cm]
1 25 × 25
5.0
2 20 × 25
15.0
3 25 × 20
15.0
4 25 × 20
20.0
5 20 × 25
37.5
6 25 × 25
40.0
Only population-level behavior is investigated. Therefore, no bees were marked,
and individual behavior or preferences are not considered. The obstacle situation was
changed at least once a day such that it is doubtful that a single bee participated in
one condition only. Additionally, in - and outbound flights were controlled to reduce
the possibility that one bee is overrepresented in the test data. Before testing, the bees
had several opportunities to fly through the test path, such that it is unlike that a naïve
bee was recorded during the test runs. The experiments were designed to observe the
phenomenology only. Any analysis to find out the reasons for the identified behavior is
not the purpose of the presented work and will be investigated in later experiments.
From all flights investigated, only those flights directly leading from the entrance to
the exit of the test section are considered for evaluation. Flights in which bees turn back
and fly more than 3 cm in the wrong direction are not included. Out of 543 flights, 411
flights were thus analyzed.
We used logistic regression with L1 penalization to identify the simplest model,
describing the decision of the bumblebees. Here, “simplest model” shall be understood
as the fewest possible parameters to get a meaningful prediction of the behavior. For
ten randomly chosen flights for each obstacle condition, the following parameters were
included as independent variables in the regression analysis:
• Distance between obstacle and sidewall
• Distance between obstacle and tunnel ceiling
• Distance between the entrance gate and obstacle
• Ratio of width to height of the obstacle
• Ratio of distance to obstacle height
• Ratio of distance to obstacle width
• Average longitudinal speed of the bumblebee
• Average longitudinal acceleration of the bumblebee
• Average longitudinal speed in the first second after flying through the gate
• Average longitudinal acceleration in the first second after flying through the gate
We used the decision of the bumblebee to fly over or around an obstacle as the dependent variable. The recordings of the bumblebee flights were used to determine speed and
acceleration for the chosen flights. The logistic regression with cross-validation was
A. Thoma et al.
Table 1. Obstacle dimensions and Distances
No Obstacle dimensions (w × h) [cm × cm] Distance d [cm]
1 25 × 25
5.0
2 20 × 25
15.0
3 25 × 20
15.0
4 25 × 20
20.0
5 20 × 25
37.5
6 25 × 25
40.0
Only population-level behavior is investigated. Therefore, no bees were marked,
and individual behavior or preferences are not considered. The obstacle situation was
changed at least once a day such that it is doubtful that a single bee participated in
one condition only. Additionally, in - and outbound flights were controlled to reduce
the possibility that one bee is overrepresented in the test data. Before testing, the bees
had several opportunities to fly through the test path, such that it is unlike that a naïve
bee was recorded during the test runs. The experiments were designed to observe the
phenomenology only. Any analysis to find out the reasons for the identified behavior is
not the purpose of the presented work and will be investigated in later experiments.
From all flights investigated, only those flights directly leading from the entrance to
the exit of the test section are considered for evaluation. Flights in which bees turn back
and fly more than 3 cm in the wrong direction are not included. Out of 543 flights, 411
flights were thus analyzed.
We used logistic regression with L1 penalization to identify the simplest model,
describing the decision of the bumblebees. Here, “simplest model” shall be understood
as the fewest possible parameters to get a meaningful prediction of the behavior. For
ten randomly chosen flights for each obstacle condition, the following parameters were
included as independent variables in the regression analysis:
• Distance between obstacle and sidewall
• Distance between obstacle and tunnel ceiling
• Distance between the entrance gate and obstacle
• Ratio of width to height of the obstacle
• Ratio of distance to obstacle height
• Ratio of distance to obstacle width
• Average longitudinal speed of the bumblebee
• Average longitudinal acceleration of the bumblebee
• Average longitudinal speed in the first second after flying through the gate
• Average longitudinal acceleration in the first second after flying through the gate
We used the decision of the bumblebee to fly over or around an obstacle as the dependent variable. The recordings of the bumblebee flights were used to determine speed and
acceleration for the chosen flights. The logistic regression with cross-validation was