

8
N. Andreakos et al.
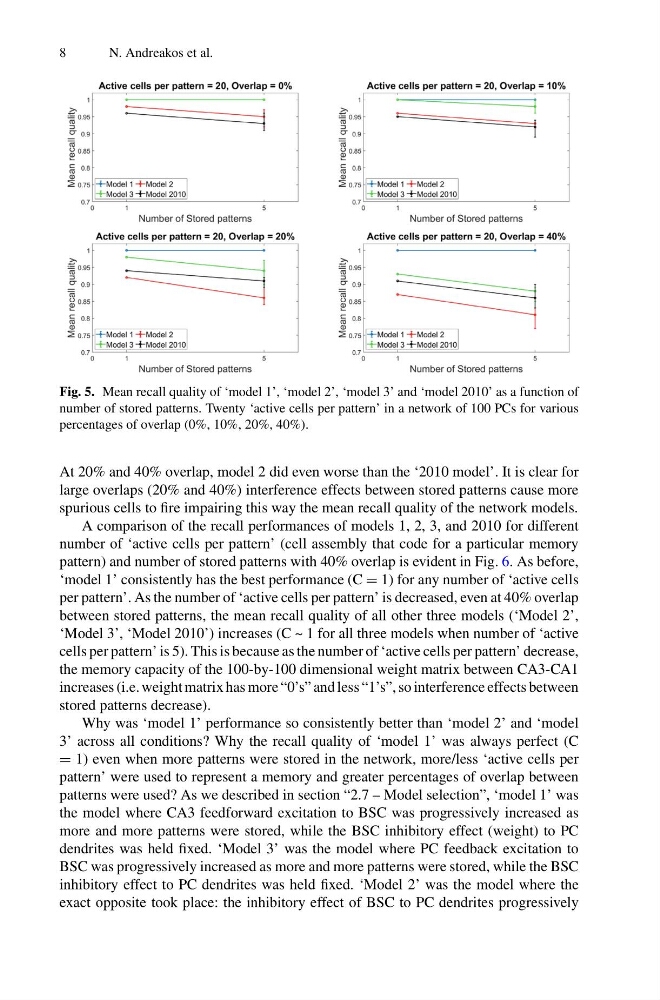
Fig. 5. Mean recall quality of ‘model 1’, ‘model 2’, ‘model 3’ and ‘model 2010’ as a function of
number of stored patterns. Twenty ‘active cells per pattern’ in a network of 100 PCs for various
percentages of overlap (0%, 10%, 20%, 40%).
At 20% and 40% overlap, model 2 did even worse than the ‘2010 model’. It is clear for
large overlaps (20% and 40%) interference effects between stored patterns cause more
spurious cells to fire impairing this way the mean recall quality of the network models.
A comparison of the recall performances of models 1, 2, 3, and 2010 for different
number of ‘active cells per pattern’ (cell assembly that code for a particular memory
pattern) and number of stored patterns with 40% overlap is evident in Fig. 6. As before,
‘model 1’ consistently has the best performance (C = 1) for any number of ‘active cells
per pattern’. As the number of ‘active cells per pattern’ is decreased, even at 40% overlap
between stored patterns, the mean recall quality of all other three models (‘Model 2’,
‘Model 3’, ‘Model 2010’) increases (C ~ 1 for all three models when number of ‘active
cells per pattern’ is 5). This is because as the number of ‘active cells per pattern’ decrease,
the memory capacity of the 100-by-100 dimensional weight matrix between CA3-CA1
increases (i.e. weight matrix has more “0’s” and less “1’s”, so interference effects between
stored patterns decrease).
Why was ‘model 1’ performance so consistently better than ‘model 2’ and ‘model
3’ across all conditions? Why the recall quality of ‘model 1’ was always perfect (C
= 1) even when more patterns were stored in the network, more/less ‘active cells per
pattern’ were used to represent a memory and greater percentages of overlap between
patterns were used? As we described in section “2.7 – Model selection”, ‘model 1’ was
the model where CA3 feedforward excitation to BSC was progressively increased as
more and more patterns were stored, while the BSC inhibitory effect (weight) to PC
dendrites was held fixed. ‘Model 3’ was the model where PC feedback excitation to
BSC was progressively increased as more and more patterns were stored, while the BSC
inhibitory effect to PC dendrites was held fixed. ‘Model 2’ was the model where the
exact opposite took place: the inhibitory effect of BSC to PC dendrites progressively
N. Andreakos et al.
Fig. 5. Mean recall quality of ‘model 1’, ‘model 2’, ‘model 3’ and ‘model 2010’ as a function of
number of stored patterns. Twenty ‘active cells per pattern’ in a network of 100 PCs for various
percentages of overlap (0%, 10%, 20%, 40%).
At 20% and 40% overlap, model 2 did even worse than the ‘2010 model’. It is clear for
large overlaps (20% and 40%) interference effects between stored patterns cause more
spurious cells to fire impairing this way the mean recall quality of the network models.
A comparison of the recall performances of models 1, 2, 3, and 2010 for different
number of ‘active cells per pattern’ (cell assembly that code for a particular memory
pattern) and number of stored patterns with 40% overlap is evident in Fig. 6. As before,
‘model 1’ consistently has the best performance (C = 1) for any number of ‘active cells
per pattern’. As the number of ‘active cells per pattern’ is decreased, even at 40% overlap
between stored patterns, the mean recall quality of all other three models (‘Model 2’,
‘Model 3’, ‘Model 2010’) increases (C ~ 1 for all three models when number of ‘active
cells per pattern’ is 5). This is because as the number of ‘active cells per pattern’ decrease,
the memory capacity of the 100-by-100 dimensional weight matrix between CA3-CA1
increases (i.e. weight matrix has more “0’s” and less “1’s”, so interference effects between
stored patterns decrease).
Why was ‘model 1’ performance so consistently better than ‘model 2’ and ‘model
3’ across all conditions? Why the recall quality of ‘model 1’ was always perfect (C
= 1) even when more patterns were stored in the network, more/less ‘active cells per
pattern’ were used to represent a memory and greater percentages of overlap between
patterns were used? As we described in section “2.7 – Model selection”, ‘model 1’ was
the model where CA3 feedforward excitation to BSC was progressively increased as
more and more patterns were stored, while the BSC inhibitory effect (weight) to PC
dendrites was held fixed. ‘Model 3’ was the model where PC feedback excitation to
BSC was progressively increased as more and more patterns were stored, while the BSC
inhibitory effect to PC dendrites was held fixed. ‘Model 2’ was the model where the
exact opposite took place: the inhibitory effect of BSC to PC dendrites progressively