

Neuromechanical Model of fCO Sensory Inhibition
149
Extension Inhibited
Flexion Inhibited
10
10
Extension Inhibited
Flexion Inhibited
Velocity Balance
Position Balance
200
Tau (ms)
100
2000
20000
100
10
10
100
100
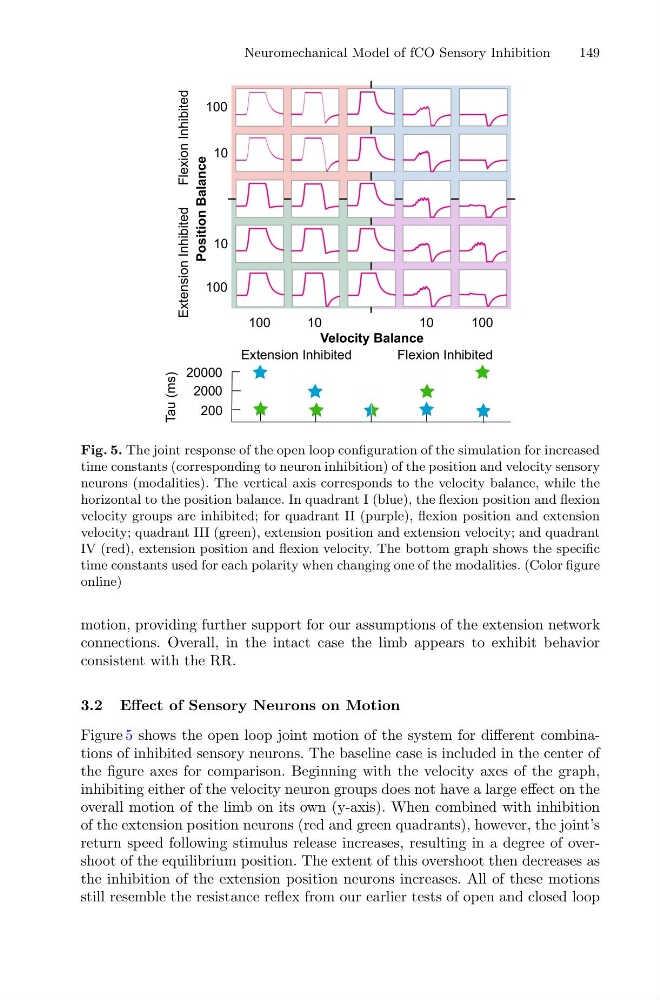
Fig. 5. The joint response of the open loop configuration of the simulation for increased
time constants (corresponding to neuron inhibition) of the position and velocity sensory
neurons (modalities). The vertical axis corresponds to the velocity balance, while the
horizontal to the position balance. In quadrant I (blue), the flexion position and flexion
velocity groups are inhibited; for quadrant II (purple), flexion position and extension
velocity; quadrant III (green), extension position and extension velocity; and quadrant
IV (red), extension position and flexion velocity. The bottom graph shows the specific
time constants used for each polarity when changing one of the modalities. (Color figure
online)
motion, providing further support for our assumptions of the extension network
connections. Overall, in the intact case the limb appears to exhibit behavior
consistent with the RR.
3.2 Effect of Sensory Neurons on Motion
Figure 5 shows the open loop joint motion of the system for different combinations of inhibited sensory neurons. The baseline case is included in the center of
the figure axes for comparison. Beginning with the velocity axes of the graph,
inhibiting either of the velocity neuron groups does not have a large effect on the
overall motion of the limb on its own (y-axis). When combined with inhibition
of the extension position neurons (red and green quadrants), however, the joint’s
return speed following stimulus release increases, resulting in a degree of overshoot of the equilibrium position. The extent of this overshoot then decreases as
the inhibition of the extension position neurons increases. All of these motions
still resemble the resistance reflex from our earlier tests of open and closed loop
149
Extension Inhibited
Flexion Inhibited
10
10
Extension Inhibited
Flexion Inhibited
Velocity Balance
Position Balance
200
Tau (ms)
100
2000
20000
100
10
10
100
100
Fig. 5. The joint response of the open loop configuration of the simulation for increased
time constants (corresponding to neuron inhibition) of the position and velocity sensory
neurons (modalities). The vertical axis corresponds to the velocity balance, while the
horizontal to the position balance. In quadrant I (blue), the flexion position and flexion
velocity groups are inhibited; for quadrant II (purple), flexion position and extension
velocity; quadrant III (green), extension position and extension velocity; and quadrant
IV (red), extension position and flexion velocity. The bottom graph shows the specific
time constants used for each polarity when changing one of the modalities. (Color figure
online)
motion, providing further support for our assumptions of the extension network
connections. Overall, in the intact case the limb appears to exhibit behavior
consistent with the RR.
3.2 Effect of Sensory Neurons on Motion
Figure 5 shows the open loop joint motion of the system for different combinations of inhibited sensory neurons. The baseline case is included in the center of
the figure axes for comparison. Beginning with the velocity axes of the graph,
inhibiting either of the velocity neuron groups does not have a large effect on the
overall motion of the limb on its own (y-axis). When combined with inhibition
of the extension position neurons (red and green quadrants), however, the joint’s
return speed following stimulus release increases, resulting in a degree of overshoot of the equilibrium position. The extent of this overshoot then decreases as
the inhibition of the extension position neurons increases. All of these motions
still resemble the resistance reflex from our earlier tests of open and closed loop