

Neuromechanical Model of fCO Sensory Inhibition
147
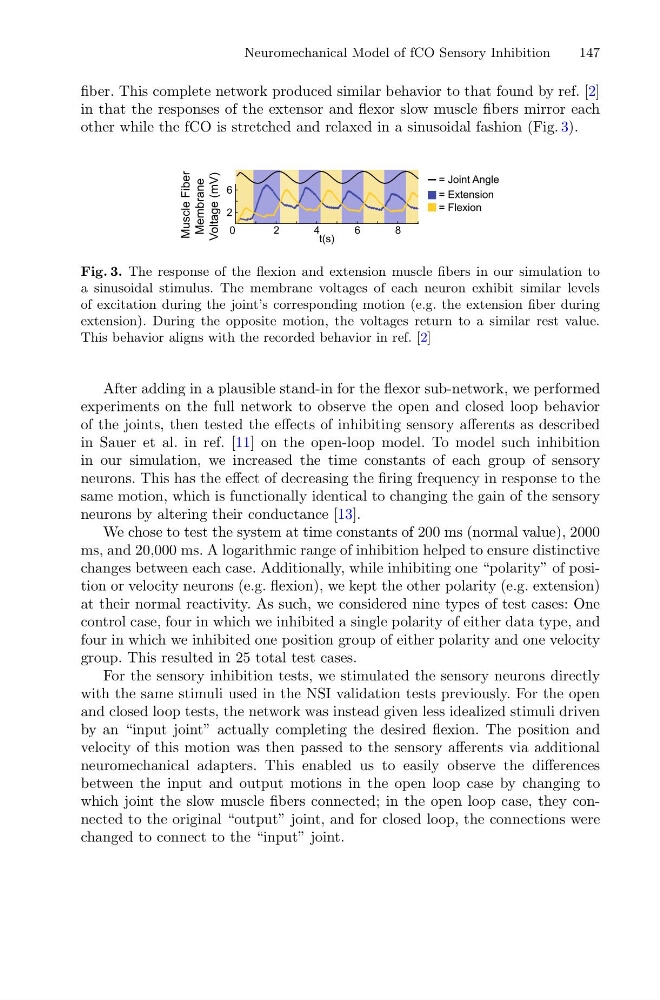
fiber. This complete network produced similar behavior to that found by ref. [2]
in that the responses of the extensor and flexor slow muscle fibers mirror each
other while the fCO is stretched and relaxed in a sinusoidal fashion (Fig. 3).
Fig. 3. The response of the flexion and extension muscle fibers in our simulation to
a sinusoidal stimulus. The membrane voltages of each neuron exhibit similar levels
of excitation during the joint’s corresponding motion (e.g. the extension fiber during
extension). During the opposite motion, the voltages return to a similar rest value.
This behavior aligns with the recorded behavior in ref. [2]
After adding in a plausible stand-in for the flexor sub-network, we performed
experiments on the full network to observe the open and closed loop behavior
of the joints, then tested the effects of inhibiting sensory afferents as described
in Sauer et al. in ref. [11] on the open-loop model. To model such inhibition
in our simulation, we increased the time constants of each group of sensory
neurons. This has the effect of decreasing the firing frequency in response to the
same motion, which is functionally identical to changing the gain of the sensory
neurons by altering their conductance [13].
We chose to test the system at time constants of 200 ms (normal value), 2000
ms, and 20,000 ms. A logarithmic range of inhibition helped to ensure distinctive
changes between each case. Additionally, while inhibiting one “polarity” of position or velocity neurons (e.g. flexion), we kept the other polarity (e.g. extension)
at their normal reactivity. As such, we considered nine types of test cases: One
control case, four in which we inhibited a single polarity of either data type, and
four in which we inhibited one position group of either polarity and one velocity
group. This resulted in 25 total test cases.
For the sensory inhibition tests, we stimulated the sensory neurons directly
with the same stimuli used in the NSI validation tests previously. For the open
and closed loop tests, the network was instead given less idealized stimuli driven
by an “input joint” actually completing the desired flexion. The position and
velocity of this motion was then passed to the sensory afferents via additional
neuromechanical adapters. This enabled us to easily observe the differences
between the input and output motions in the open loop case by changing to
which joint the slow muscle fibers connected; in the open loop case, they connected to the original “output” joint, and for closed loop, the connections were
changed to connect to the “input” joint.
147
fiber. This complete network produced similar behavior to that found by ref. [2]
in that the responses of the extensor and flexor slow muscle fibers mirror each
other while the fCO is stretched and relaxed in a sinusoidal fashion (Fig. 3).
Fig. 3. The response of the flexion and extension muscle fibers in our simulation to
a sinusoidal stimulus. The membrane voltages of each neuron exhibit similar levels
of excitation during the joint’s corresponding motion (e.g. the extension fiber during
extension). During the opposite motion, the voltages return to a similar rest value.
This behavior aligns with the recorded behavior in ref. [2]
After adding in a plausible stand-in for the flexor sub-network, we performed
experiments on the full network to observe the open and closed loop behavior
of the joints, then tested the effects of inhibiting sensory afferents as described
in Sauer et al. in ref. [11] on the open-loop model. To model such inhibition
in our simulation, we increased the time constants of each group of sensory
neurons. This has the effect of decreasing the firing frequency in response to the
same motion, which is functionally identical to changing the gain of the sensory
neurons by altering their conductance [13].
We chose to test the system at time constants of 200 ms (normal value), 2000
ms, and 20,000 ms. A logarithmic range of inhibition helped to ensure distinctive
changes between each case. Additionally, while inhibiting one “polarity” of position or velocity neurons (e.g. flexion), we kept the other polarity (e.g. extension)
at their normal reactivity. As such, we considered nine types of test cases: One
control case, four in which we inhibited a single polarity of either data type, and
four in which we inhibited one position group of either polarity and one velocity
group. This resulted in 25 total test cases.
For the sensory inhibition tests, we stimulated the sensory neurons directly
with the same stimuli used in the NSI validation tests previously. For the open
and closed loop tests, the network was instead given less idealized stimuli driven
by an “input joint” actually completing the desired flexion. The position and
velocity of this motion was then passed to the sensory afferents via additional
neuromechanical adapters. This enabled us to easily observe the differences
between the input and output motions in the open loop case by changing to
which joint the slow muscle fibers connected; in the open loop case, they connected to the original “output” joint, and for closed loop, the connections were
changed to connect to the “input” joint.