

134
V. Gabler et al.
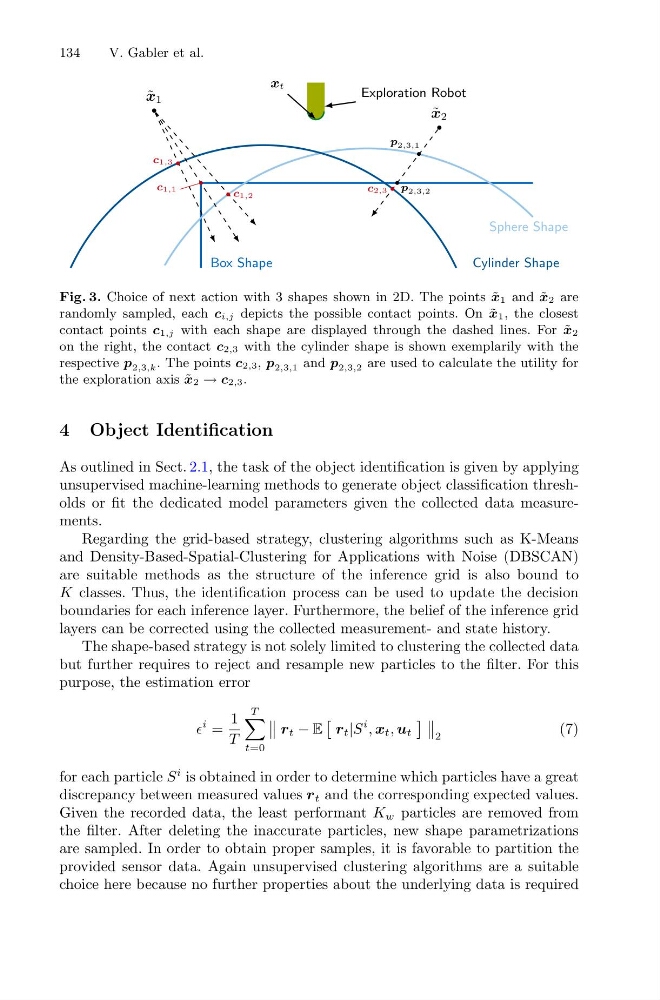
Fig. 3. Choice of next action with 3 shapes shown in 2D. The points ˜
x1 and ˜
x2 are
randomly sampled, each ci,j depicts the possible contact points. On ˜
x1, the closest
contact points c1,j with each shape are displayed through the dashed lines. For ˜
x2
on the right, the contact c2,3 with the cylinder shape is shown exemplarily with the
respective p 2,3,k . The points c2,3, p 2,3,1 and p 2,3,2 are used to calculate the utility for
the exploration axis ˜
x2 → c2,3.
4 Object Identification
As outlined in Sect. 2.1, the task of the object identification is given by applying
unsupervised machine-learning methods to generate object classification thresholds or fit the dedicated model parameters given the collected data measurements.
Regarding the grid-based strategy, clustering algorithms such as K-Means
and Density-Based-Spatial-Clustering for Applications with Noise (DBSCAN)
are suitable methods as the structure of the inference grid is also bound to
K classes. Thus, the identification process can be used to update the decision
boundaries for each inference layer. Furthermore, the belief of the inference grid
layers can be corrected using the collected measurement- and state history.
The shape-based strategy is not solely limited to clustering the collected data
but further requires to reject and resample new particles to the filter. For this
purpose, the estimation error
i =
1
T
T
t=0
r t − E
r t |S
i
, x t , u t
2
(7)
for each particle S
i is obtained in order to determine which particles have a great
discrepancy between measured values r t and the corresponding expected values.
Given the recorded data, the least performant K w particles are removed from
the filter. After deleting the inaccurate particles, new shape parametrizations
are sampled. In order to obtain proper samples, it is favorable to partition the
provided sensor data. Again unsupervised clustering algorithms are a suitable
choice here because no further properties about the underlying data is required
V. Gabler et al.
Fig. 3. Choice of next action with 3 shapes shown in 2D. The points ˜
x1 and ˜
x2 are
randomly sampled, each ci,j depicts the possible contact points. On ˜
x1, the closest
contact points c1,j with each shape are displayed through the dashed lines. For ˜
x2
on the right, the contact c2,3 with the cylinder shape is shown exemplarily with the
respective p 2,3,k . The points c2,3, p 2,3,1 and p 2,3,2 are used to calculate the utility for
the exploration axis ˜
x2 → c2,3.
4 Object Identification
As outlined in Sect. 2.1, the task of the object identification is given by applying
unsupervised machine-learning methods to generate object classification thresholds or fit the dedicated model parameters given the collected data measurements.
Regarding the grid-based strategy, clustering algorithms such as K-Means
and Density-Based-Spatial-Clustering for Applications with Noise (DBSCAN)
are suitable methods as the structure of the inference grid is also bound to
K classes. Thus, the identification process can be used to update the decision
boundaries for each inference layer. Furthermore, the belief of the inference grid
layers can be corrected using the collected measurement- and state history.
The shape-based strategy is not solely limited to clustering the collected data
but further requires to reject and resample new particles to the filter. For this
purpose, the estimation error
i =
1
T
T
t=0
r t − E
r t |S
i
, x t , u t
2
(7)
for each particle S
i is obtained in order to determine which particles have a great
discrepancy between measured values r t and the corresponding expected values.
Given the recorded data, the least performant K w particles are removed from
the filter. After deleting the inaccurate particles, new shape parametrizations
are sampled. In order to obtain proper samples, it is favorable to partition the
provided sensor data. Again unsupervised clustering algorithms are a suitable
choice here because no further properties about the underlying data is required