

16 Theoretical Foundations of Super-Resolution in Microspherical Nanoscopy
431
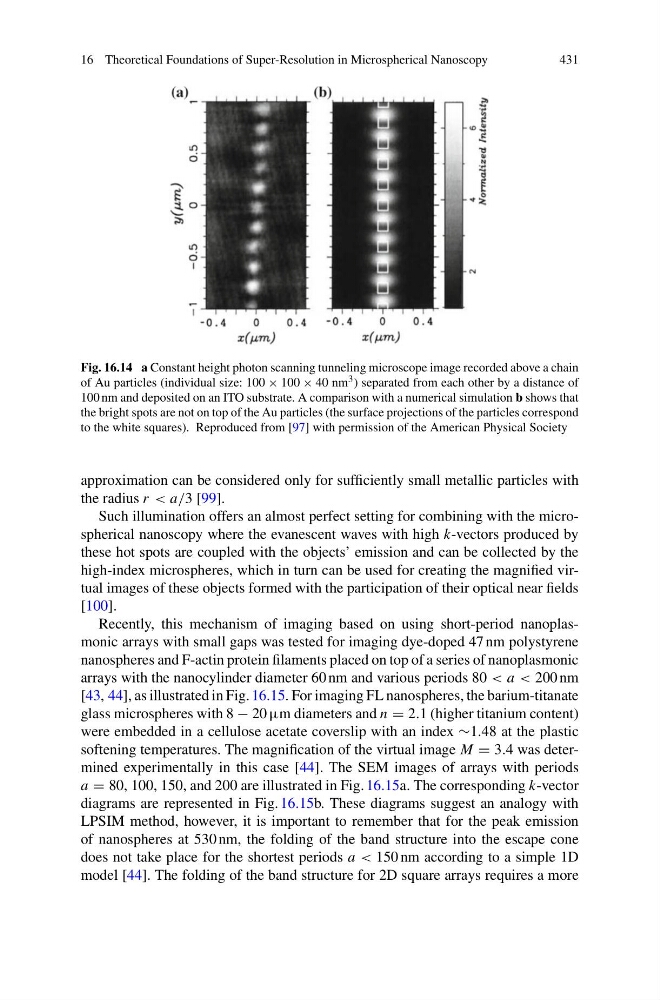
Fig. 16.14 a Constant height photon scanning tunneling microscope image recorded above a chain
of Au particles (individual size: 100 × 100 × 40 nm 3 ) separated from each other by a distance of
100 nm and deposited on an ITO substrate. A comparison with a numerical simulation b shows that
the bright spots are not on top of the Au particles (the surface projections of the particles correspond
to the white squares). Reproduced from [97] with permission of the American Physical Society
approximation can be considered only for sufficiently small metallic particles with
the radius r < a/3 [99].
Such illumination offers an almost perfect setting for combining with the microspherical nanoscopy where the evanescent waves with high k-vectors produced by
these hot spots are coupled with the objects’ emission and can be collected by the
high-index microspheres, which in turn can be used for creating the magnified virtual images of these objects formed with the participation of their optical near fields
[100].
Recently, this mechanism of imaging based on using short-period nanoplasmonic arrays with small gaps was tested for imaging dye-doped 47 nm polystyrene
nanospheres and F-actin protein filaments placed on top of a series of nanoplasmonic
arrays with the nanocylinder diameter 60 nm and various periods 80 < a < 200 nm
[43, 44], as illustrated in Fig. 16.15. For imaging FL nanospheres, the barium-titanate
glass microspheres with 8 − 20 µm diameters and n = 2.1 (higher titanium content)
were embedded in a cellulose acetate coverslip with an index ∼1.48 at the plastic
softening temperatures. The magnification of the virtual image M = 3.4 was determined experimentally in this case [44]. The SEM images of arrays with periods
a = 80, 100, 150, and 200 are illustrated in Fig. 16.15a. The corresponding k-vector
diagrams are represented in Fig. 16.15b. These diagrams suggest an analogy with
LPSIM method, however, it is important to remember that for the peak emission
of nanospheres at 530 nm, the folding of the band structure into the escape cone
does not take place for the shortest periods a < 150 nm according to a simple 1D
model [44]. The folding of the band structure for 2D square arrays requires a more
431
Fig. 16.14 a Constant height photon scanning tunneling microscope image recorded above a chain
of Au particles (individual size: 100 × 100 × 40 nm 3 ) separated from each other by a distance of
100 nm and deposited on an ITO substrate. A comparison with a numerical simulation b shows that
the bright spots are not on top of the Au particles (the surface projections of the particles correspond
to the white squares). Reproduced from [97] with permission of the American Physical Society
approximation can be considered only for sufficiently small metallic particles with
the radius r < a/3 [99].
Such illumination offers an almost perfect setting for combining with the microspherical nanoscopy where the evanescent waves with high k-vectors produced by
these hot spots are coupled with the objects’ emission and can be collected by the
high-index microspheres, which in turn can be used for creating the magnified virtual images of these objects formed with the participation of their optical near fields
[100].
Recently, this mechanism of imaging based on using short-period nanoplasmonic arrays with small gaps was tested for imaging dye-doped 47 nm polystyrene
nanospheres and F-actin protein filaments placed on top of a series of nanoplasmonic
arrays with the nanocylinder diameter 60 nm and various periods 80 < a < 200 nm
[43, 44], as illustrated in Fig. 16.15. For imaging FL nanospheres, the barium-titanate
glass microspheres with 8 − 20 µm diameters and n = 2.1 (higher titanium content)
were embedded in a cellulose acetate coverslip with an index ∼1.48 at the plastic
softening temperatures. The magnification of the virtual image M = 3.4 was determined experimentally in this case [44]. The SEM images of arrays with periods
a = 80, 100, 150, and 200 are illustrated in Fig. 16.15a. The corresponding k-vector
diagrams are represented in Fig. 16.15b. These diagrams suggest an analogy with
LPSIM method, however, it is important to remember that for the peak emission
of nanospheres at 530 nm, the folding of the band structure into the escape cone
does not take place for the shortest periods a < 150 nm according to a simple 1D
model [44]. The folding of the band structure for 2D square arrays requires a more