

16 Theoretical Foundations of Super-Resolution in Microspherical Nanoscopy
421
Figure 16.7 shows the images obtained for several cases listed in Table 16.2 when
the two incoherent sources are separated by the corresponding values of W/(Mλ)
which are defined as resolution. In all cases, the images form a weak but noticeable
dip in the center indicating the possibility to resolve the sources. However, in the
resonant case, Fig. 16.7a, the image of the two sources have significant artifacts in
the form of the sidelobes.
16.4.2 Coherent Versus Incoherent Imaging
The results of the classical imaging theory based on point emission near the microparticle predicts resolution which is worse than the experimental values even if we take
into account the increase of the background index in the case of high-index liquid
immersed microspheres. However, there can be factors that may play a significant
role in microspherical imaging and yet are left out of this basic theory. One of such
factors is the presence of coherence. Coherent illumination in total internal reflection dark-field microscopy results in subwavelength resolution of 190 nm fluorescent
polystyrene beads [78]. However, the resolution enhancement comes at a price as
the images become distorted [79]. In [80], the role of coherence in microspherical
imaging was also studied using the model of coherent current sources emitting near
a microsphere. References [81, 82] studied the imaging of multiple point sources
which emit in some specific phases.
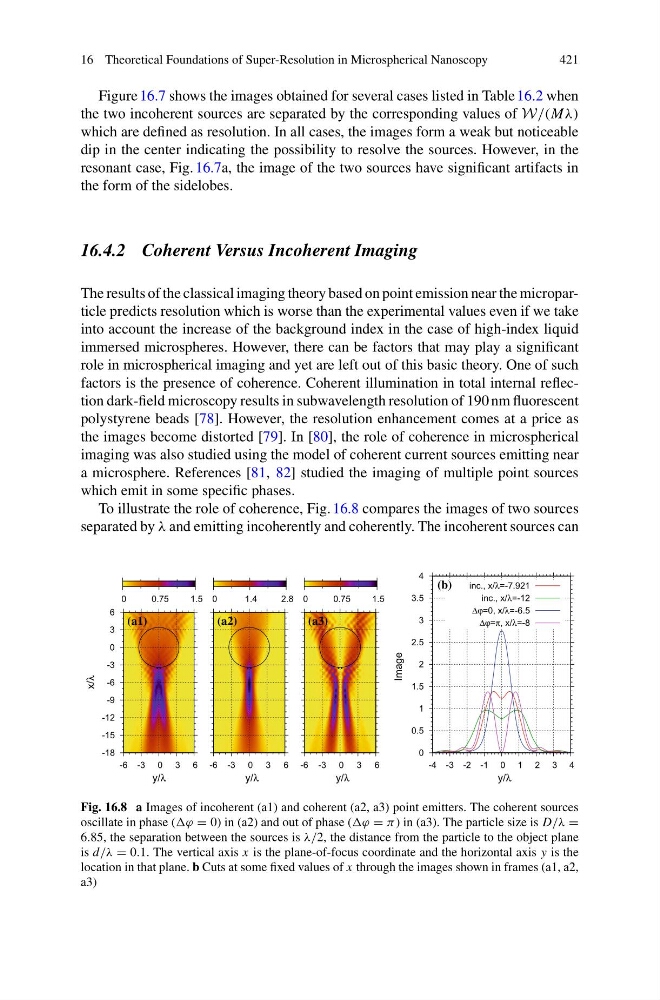
To illustrate the role of coherence, Fig. 16.8 compares the images of two sources
separated by λ and emitting incoherently and coherently. The incoherent sources can
x/λ
y/λ
y/λ
y/λ
y/λ
-18
-15
-12
-9
-6
-3
0
3
6
-6 -3 0 3 6
0
0.75
1.5
(a1)
-6 -3 0 3 6
0
1.4
2.8
(a2)
-6 -3 0 3 6
0
0.75
1.5
(a3)
Image
inc., x/λ=-7.921
inc., x/λ=-12
Δϕ=0, x/λ=-6.5
Δϕ=π, x/λ=-8
0
0.5
1
1.5
2
2.5
3
3.5
4
-4 -3 -2 -1 0 1 2 3 4
(b)
Fig. 16.8 a Images of incoherent (a1) and coherent (a2, a3) point emitters. The coherent sources
oscillate in phase ( = 0) in (a2) and out of phase ( = π ) in (a3). The particle size is D/λ =
6.85, the separation between the sources is λ/2, the distance from the particle to the object plane
is d/λ = 0.1. The vertical axis x is the plane-of-focus coordinate and the horizontal axis y is the
location in that plane. b Cuts at some fixed values of x through the images shown in frames (a1, a2,
a3)
421
Figure 16.7 shows the images obtained for several cases listed in Table 16.2 when
the two incoherent sources are separated by the corresponding values of W/(Mλ)
which are defined as resolution. In all cases, the images form a weak but noticeable
dip in the center indicating the possibility to resolve the sources. However, in the
resonant case, Fig. 16.7a, the image of the two sources have significant artifacts in
the form of the sidelobes.
16.4.2 Coherent Versus Incoherent Imaging
The results of the classical imaging theory based on point emission near the microparticle predicts resolution which is worse than the experimental values even if we take
into account the increase of the background index in the case of high-index liquid
immersed microspheres. However, there can be factors that may play a significant
role in microspherical imaging and yet are left out of this basic theory. One of such
factors is the presence of coherence. Coherent illumination in total internal reflection dark-field microscopy results in subwavelength resolution of 190 nm fluorescent
polystyrene beads [78]. However, the resolution enhancement comes at a price as
the images become distorted [79]. In [80], the role of coherence in microspherical
imaging was also studied using the model of coherent current sources emitting near
a microsphere. References [81, 82] studied the imaging of multiple point sources
which emit in some specific phases.
To illustrate the role of coherence, Fig. 16.8 compares the images of two sources
separated by λ and emitting incoherently and coherently. The incoherent sources can
x/λ
y/λ
y/λ
y/λ
y/λ
-18
-15
-12
-9
-6
-3
0
3
6
-6 -3 0 3 6
0
0.75
1.5
(a1)
-6 -3 0 3 6
0
1.4
2.8
(a2)
-6 -3 0 3 6
0
0.75
1.5
(a3)
Image
inc., x/λ=-7.921
inc., x/λ=-12
Δϕ=0, x/λ=-6.5
Δϕ=π, x/λ=-8
0
0.5
1
1.5
2
2.5
3
3.5
4
-4 -3 -2 -1 0 1 2 3 4
(b)
Fig. 16.8 a Images of incoherent (a1) and coherent (a2, a3) point emitters. The coherent sources
oscillate in phase ( = 0) in (a2) and out of phase ( = π ) in (a3). The particle size is D/λ =
6.85, the separation between the sources is λ/2, the distance from the particle to the object plane
is d/λ = 0.1. The vertical axis x is the plane-of-focus coordinate and the horizontal axis y is the
location in that plane. b Cuts at some fixed values of x through the images shown in frames (a1, a2,
a3)