

13 Super-Resolution Microscopy Techniques Based …
331
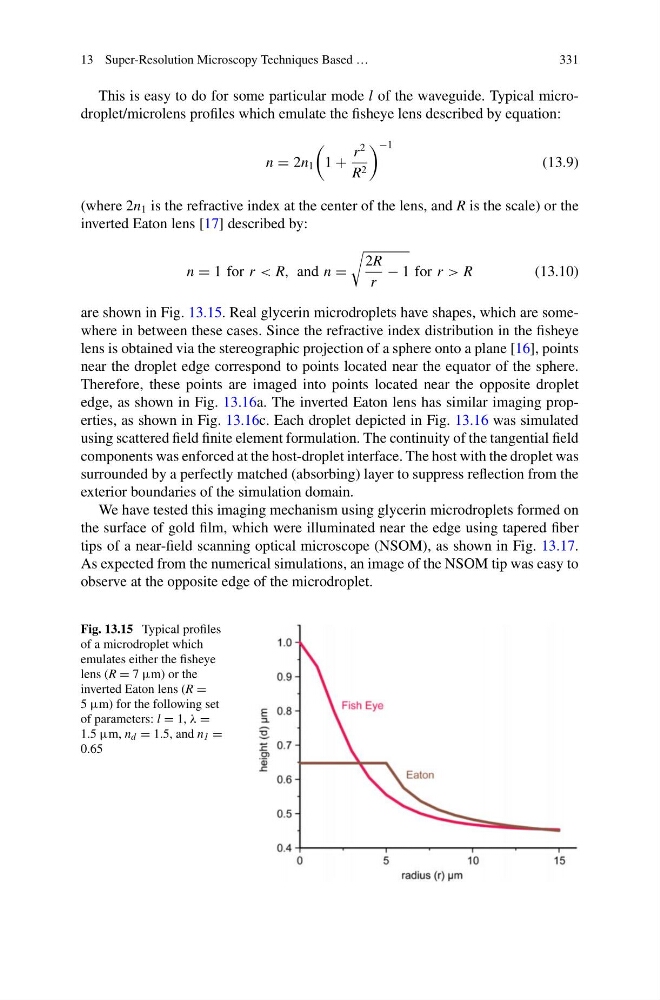
This is easy to do for some particular mode l of the waveguide. Typical microdroplet/microlens profiles which emulate the fisheye lens described by equation:
n = 2n 1
1 +
r
2
R 2
−1
(13.9)
(where 2n 1 is the refractive index at the center of the lens, and R is the scale) or the
inverted Eaton lens [17] described by:
n = 1 for r < R, and n =
2R
r
− 1 for r > R
(13.10)
are shown in Fig. 13.15. Real glycerin microdroplets have shapes, which are somewhere in between these cases. Since the refractive index distribution in the fisheye
lens is obtained via the stereographic projection of a sphere onto a plane [16], points
near the droplet edge correspond to points located near the equator of the sphere.
Therefore, these points are imaged into points located near the opposite droplet
edge, as shown in Fig. 13.16a. The inverted Eaton lens has similar imaging properties, as shown in Fig. 13.16c. Each droplet depicted in Fig. 13.16 was simulated
using scattered field finite element formulation. The continuity of the tangential field
components was enforced at the host-droplet interface. The host with the droplet was
surrounded by a perfectly matched (absorbing) layer to suppress reflection from the
exterior boundaries of the simulation domain.
We have tested this imaging mechanism using glycerin microdroplets formed on
the surface of gold film, which were illuminated near the edge using tapered fiber
tips of a near-field scanning optical microscope (NSOM), as shown in Fig. 13.17.
As expected from the numerical simulations, an image of the NSOM tip was easy to
observe at the opposite edge of the microdroplet.
Fig. 13.15 Typical profiles
of a microdroplet which
emulates either the fisheye
lens (R = 7 µm) or the
inverted Eaton lens (R =
5 µm) for the following set
of parameters: l = 1, λ =
1.5 µm, n d = 1.5, and n 1 =
0.65
331
This is easy to do for some particular mode l of the waveguide. Typical microdroplet/microlens profiles which emulate the fisheye lens described by equation:
n = 2n 1
1 +
r
2
R 2
−1
(13.9)
(where 2n 1 is the refractive index at the center of the lens, and R is the scale) or the
inverted Eaton lens [17] described by:
n = 1 for r < R, and n =
2R
r
− 1 for r > R
(13.10)
are shown in Fig. 13.15. Real glycerin microdroplets have shapes, which are somewhere in between these cases. Since the refractive index distribution in the fisheye
lens is obtained via the stereographic projection of a sphere onto a plane [16], points
near the droplet edge correspond to points located near the equator of the sphere.
Therefore, these points are imaged into points located near the opposite droplet
edge, as shown in Fig. 13.16a. The inverted Eaton lens has similar imaging properties, as shown in Fig. 13.16c. Each droplet depicted in Fig. 13.16 was simulated
using scattered field finite element formulation. The continuity of the tangential field
components was enforced at the host-droplet interface. The host with the droplet was
surrounded by a perfectly matched (absorbing) layer to suppress reflection from the
exterior boundaries of the simulation domain.
We have tested this imaging mechanism using glycerin microdroplets formed on
the surface of gold film, which were illuminated near the edge using tapered fiber
tips of a near-field scanning optical microscope (NSOM), as shown in Fig. 13.17.
As expected from the numerical simulations, an image of the NSOM tip was easy to
observe at the opposite edge of the microdroplet.
Fig. 13.15 Typical profiles
of a microdroplet which
emulates either the fisheye
lens (R = 7 µm) or the
inverted Eaton lens (R =
5 µm) for the following set
of parameters: l = 1, λ =
1.5 µm, n d = 1.5, and n 1 =
0.65