

324
I. I. Smolyaninov and V. N. Smolyaninova
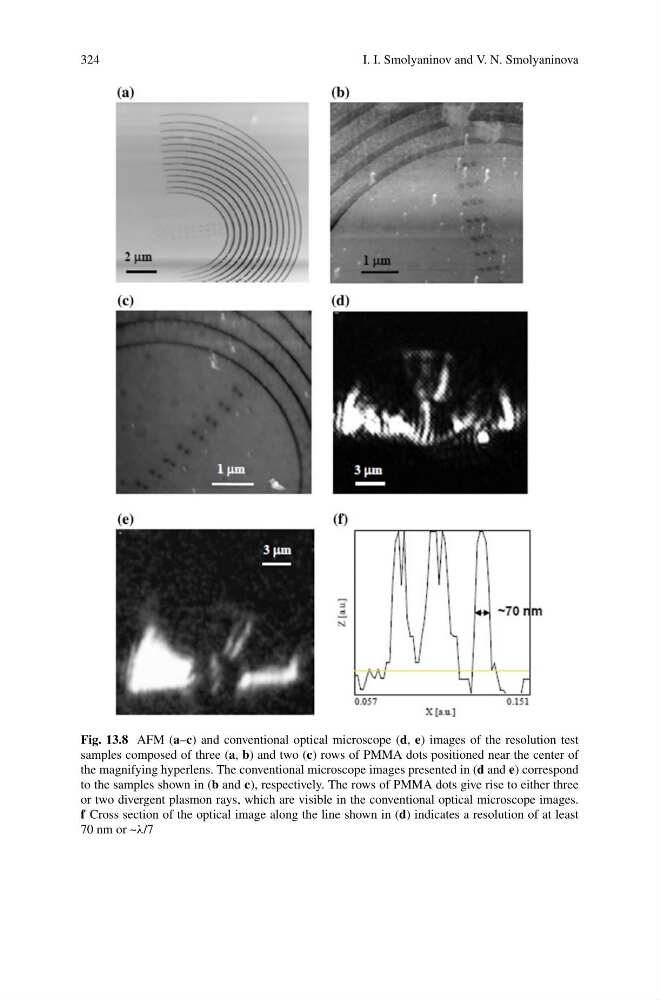
Fig. 13.8 AFM (a–c) and conventional optical microscope (d, e) images of the resolution test
samples composed of three (a, b) and two (c) rows of PMMA dots positioned near the center of
the magnifying hyperlens. The conventional microscope images presented in (d and e) correspond
to the samples shown in (b and c), respectively. The rows of PMMA dots give rise to either three
or two divergent plasmon rays, which are visible in the conventional optical microscope images.
f Cross section of the optical image along the line shown in (d) indicates a resolution of at least
70 nm or ~λ/7
I. I. Smolyaninov and V. N. Smolyaninova
Fig. 13.8 AFM (a–c) and conventional optical microscope (d, e) images of the resolution test
samples composed of three (a, b) and two (c) rows of PMMA dots positioned near the center of
the magnifying hyperlens. The conventional microscope images presented in (d and e) correspond
to the samples shown in (b and c), respectively. The rows of PMMA dots give rise to either three
or two divergent plasmon rays, which are visible in the conventional optical microscope images.
f Cross section of the optical image along the line shown in (d) indicates a resolution of at least
70 nm or ~λ/7