

284
O. Tzang et al.
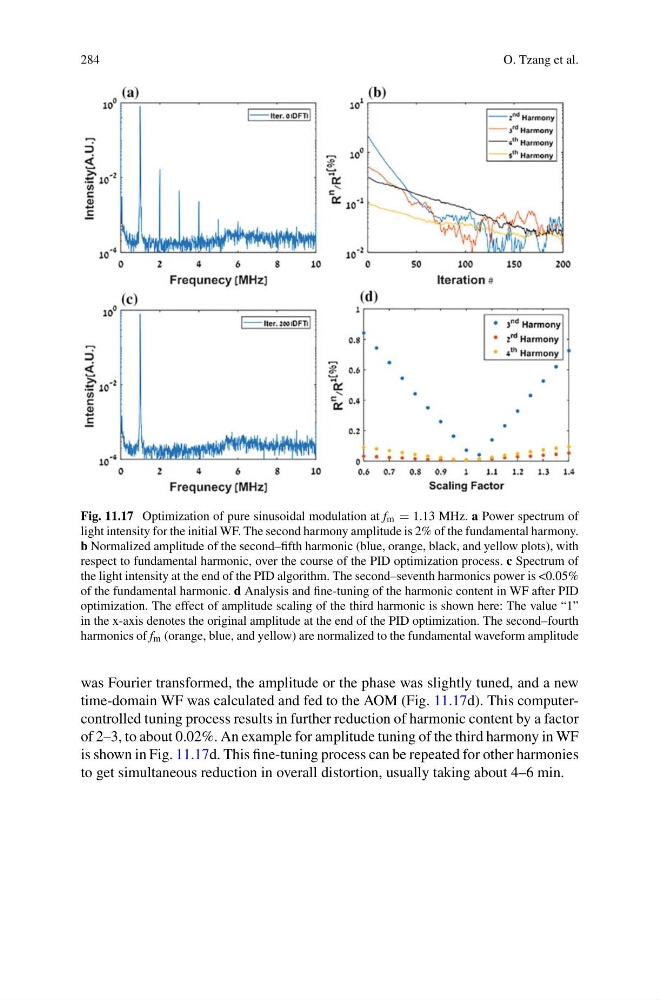
Fig. 11.17 Optimization of pure sinusoidal modulation at f m = 1.13 MHz. a Power spectrum of
light intensity for the initial WF. The second harmony amplitude is 2% of the fundamental harmony.
b Normalized amplitude of the second–fifth harmonic (blue, orange, black, and yellow plots), with
respect to fundamental harmonic, over the course of the PID optimization process. c Spectrum of
the light intensity at the end of the PID algorithm. The second–seventh harmonics power is <0.05%
of the fundamental harmonic. d Analysis and fine-tuning of the harmonic content in WF after PID
optimization. The effect of amplitude scaling of the third harmonic is shown here: The value “1”
in the x-axis denotes the original amplitude at the end of the PID optimization. The second–fourth
harmonics of f m (orange, blue, and yellow) are normalized to the fundamental waveform amplitude
was Fourier transformed, the amplitude or the phase was slightly tuned, and a new
time-domain WF was calculated and fed to the AOM (Fig. 11.17d). This computercontrolled tuning process results in further reduction of harmonic content by a factor
of 2–3, to about 0.02%. An example for amplitude tuning of the third harmony in WF
is shown in Fig. 11.17d. This fine-tuning process can be repeated for other harmonies
to get simultaneous reduction in overall distortion, usually taking about 4–6 min.
O. Tzang et al.
Fig. 11.17 Optimization of pure sinusoidal modulation at f m = 1.13 MHz. a Power spectrum of
light intensity for the initial WF. The second harmony amplitude is 2% of the fundamental harmony.
b Normalized amplitude of the second–fifth harmonic (blue, orange, black, and yellow plots), with
respect to fundamental harmonic, over the course of the PID optimization process. c Spectrum of
the light intensity at the end of the PID algorithm. The second–seventh harmonics power is <0.05%
of the fundamental harmonic. d Analysis and fine-tuning of the harmonic content in WF after PID
optimization. The effect of amplitude scaling of the third harmonic is shown here: The value “1”
in the x-axis denotes the original amplitude at the end of the PID optimization. The second–fourth
harmonics of f m (orange, blue, and yellow) are normalized to the fundamental waveform amplitude
was Fourier transformed, the amplitude or the phase was slightly tuned, and a new
time-domain WF was calculated and fed to the AOM (Fig. 11.17d). This computercontrolled tuning process results in further reduction of harmonic content by a factor
of 2–3, to about 0.02%. An example for amplitude tuning of the third harmony in WF
is shown in Fig. 11.17d. This fine-tuning process can be repeated for other harmonies
to get simultaneous reduction in overall distortion, usually taking about 4–6 min.