

11 Label-Free Super-Resolution Microscopy by Nonlinear …
279
that the probe laser is monitoring a surface that has reached full thermalization as
imprinted by the focused pump laser. These conditions are practically achieved in a
P&P delay up to about 5 ps.
The simulated intensity changes of the Raman peaks with temperature in selected
spectral ROIs (Fig. 11.12b) show that while the integrated intensity of the whole
Raman peak changes almost linearly (black curve), the Raman intensity in a specific
spectral ROI (gray rectangle, Fig. 11.11a) is equivalent to introducing a fourth-order
nonlinearity versus temperature (red curve). This dependence is vital for achieving
SR.
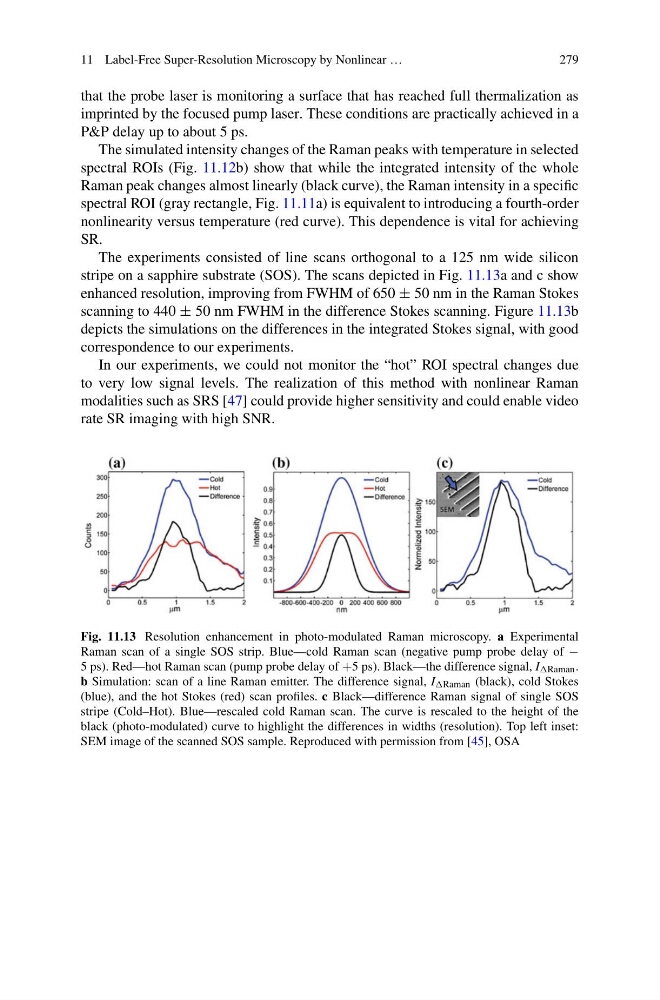
The experiments consisted of line scans orthogonal to a 125 nm wide silicon
stripe on a sapphire substrate (SOS). The scans depicted in Fig. 11.13a and c show
enhanced resolution, improving from FWHM of 650 ± 50 nm in the Raman Stokes
scanning to 440 ± 50 nm FWHM in the difference Stokes scanning. Figure 11.13b
depicts the simulations on the differences in the integrated Stokes signal, with good
correspondence to our experiments.
In our experiments, we could not monitor the “hot” ROI spectral changes due
to very low signal levels. The realization of this method with nonlinear Raman
modalities such as SRS [47] could provide higher sensitivity and could enable video
rate SR imaging with high SNR.
Fig. 11.13 Resolution enhancement in photo-modulated Raman microscopy. a Experimental
Raman scan of a single SOS strip. Blue—cold Raman scan (negative pump probe delay of −
5 ps). Red—hot Raman scan (pump probe delay of +5 ps). Black—the difference signal, I Raman .
b Simulation: scan of a line Raman emitter. The difference signal, I Raman (black), cold Stokes
(blue), and the hot Stokes (red) scan profiles. c Black—difference Raman signal of single SOS
stripe (Cold–Hot). Blue—rescaled cold Raman scan. The curve is rescaled to the height of the
black (photo-modulated) curve to highlight the differences in widths (resolution). Top left inset:
SEM image of the scanned SOS sample. Reproduced with permission from [45], OSA
279
that the probe laser is monitoring a surface that has reached full thermalization as
imprinted by the focused pump laser. These conditions are practically achieved in a
P&P delay up to about 5 ps.
The simulated intensity changes of the Raman peaks with temperature in selected
spectral ROIs (Fig. 11.12b) show that while the integrated intensity of the whole
Raman peak changes almost linearly (black curve), the Raman intensity in a specific
spectral ROI (gray rectangle, Fig. 11.11a) is equivalent to introducing a fourth-order
nonlinearity versus temperature (red curve). This dependence is vital for achieving
SR.
The experiments consisted of line scans orthogonal to a 125 nm wide silicon
stripe on a sapphire substrate (SOS). The scans depicted in Fig. 11.13a and c show
enhanced resolution, improving from FWHM of 650 ± 50 nm in the Raman Stokes
scanning to 440 ± 50 nm FWHM in the difference Stokes scanning. Figure 11.13b
depicts the simulations on the differences in the integrated Stokes signal, with good
correspondence to our experiments.
In our experiments, we could not monitor the “hot” ROI spectral changes due
to very low signal levels. The realization of this method with nonlinear Raman
modalities such as SRS [47] could provide higher sensitivity and could enable video
rate SR imaging with high SNR.
Fig. 11.13 Resolution enhancement in photo-modulated Raman microscopy. a Experimental
Raman scan of a single SOS strip. Blue—cold Raman scan (negative pump probe delay of −
5 ps). Red—hot Raman scan (pump probe delay of +5 ps). Black—the difference signal, I Raman .
b Simulation: scan of a line Raman emitter. The difference signal, I Raman (black), cold Stokes
(blue), and the hot Stokes (red) scan profiles. c Black—difference Raman signal of single SOS
stripe (Cold–Hot). Blue—rescaled cold Raman scan. The curve is rescaled to the height of the
black (photo-modulated) curve to highlight the differences in widths (resolution). Top left inset:
SEM image of the scanned SOS sample. Reproduced with permission from [45], OSA