

10 Super-Resolution Imaging Based on Nonlinear Plasmonic Scattering
249
ally z-scan technique is used to study these absorption nonlinearities, so only ensemble behaviours are observed. Recently, our group proposed to use xy-scan in a laser
scanning microscope to study optical properties of a single plasmonic nanostructure
[24], leading to the novel discovery of saturable and reverse saturable scattering, as
shown below.
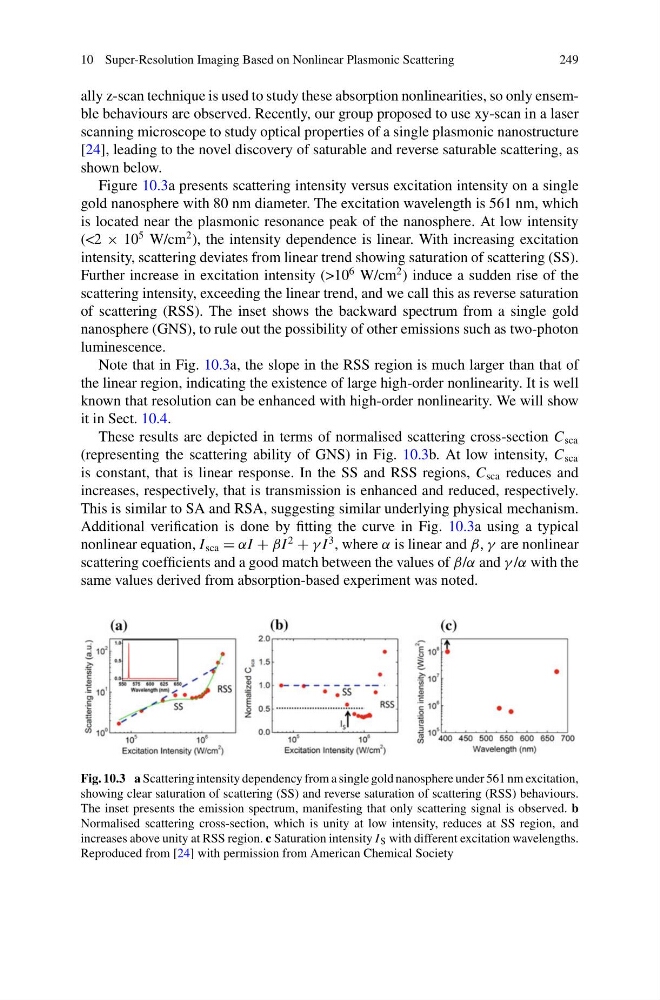
Figure 10.3a presents scattering intensity versus excitation intensity on a single
gold nanosphere with 80 nm diameter. The excitation wavelength is 561 nm, which
is located near the plasmonic resonance peak of the nanosphere. At low intensity
(<2 × 10
5 W/cm
2 ), the intensity dependence is linear. With increasing excitation
intensity, scattering deviates from linear trend showing saturation of scattering (SS).
Further increase in excitation intensity (>10
6 W/cm
2 ) induce a sudden rise of the
scattering intensity, exceeding the linear trend, and we call this as reverse saturation
of scattering (RSS). The inset shows the backward spectrum from a single gold
nanosphere (GNS), to rule out the possibility of other emissions such as two-photon
luminescence.
Note that in Fig. 10.3a, the slope in the RSS region is much larger than that of
the linear region, indicating the existence of large high-order nonlinearity. It is well
known that resolution can be enhanced with high-order nonlinearity. We will show
it in Sect. 10.4.
These results are depicted in terms of normalised scattering cross-section C sca
(representing the scattering ability of GNS) in Fig. 10.3b. At low intensity, C sca
is constant, that is linear response. In the SS and RSS regions, C sca reduces and
increases, respectively, that is transmission is enhanced and reduced, respectively.
This is similar to SA and RSA, suggesting similar underlying physical mechanism.
Additional verification is done by fitting the curve in Fig. 10.3a using a typical
nonlinear equation, I sca = αI + βI
2
+ γ I
3 , where α is linear and β, γ are nonlinear
scattering coefficients and a good match between the values of β/α and γ /α with the
same values derived from absorption-based experiment was noted.
Fig. 10.3 a Scattering intensity dependency from a single gold nanosphere under 561 nm excitation,
showing clear saturation of scattering (SS) and reverse saturation of scattering (RSS) behaviours.
The inset presents the emission spectrum, manifesting that only scattering signal is observed. b
Normalised scattering cross-section, which is unity at low intensity, reduces at SS region, and
increases above unity at RSS region. c Saturation intensity I S with different excitation wavelengths.
Reproduced from [24] with permission from American Chemical Society
249
ally z-scan technique is used to study these absorption nonlinearities, so only ensemble behaviours are observed. Recently, our group proposed to use xy-scan in a laser
scanning microscope to study optical properties of a single plasmonic nanostructure
[24], leading to the novel discovery of saturable and reverse saturable scattering, as
shown below.
Figure 10.3a presents scattering intensity versus excitation intensity on a single
gold nanosphere with 80 nm diameter. The excitation wavelength is 561 nm, which
is located near the plasmonic resonance peak of the nanosphere. At low intensity
(<2 × 10
5 W/cm
2 ), the intensity dependence is linear. With increasing excitation
intensity, scattering deviates from linear trend showing saturation of scattering (SS).
Further increase in excitation intensity (>10
6 W/cm
2 ) induce a sudden rise of the
scattering intensity, exceeding the linear trend, and we call this as reverse saturation
of scattering (RSS). The inset shows the backward spectrum from a single gold
nanosphere (GNS), to rule out the possibility of other emissions such as two-photon
luminescence.
Note that in Fig. 10.3a, the slope in the RSS region is much larger than that of
the linear region, indicating the existence of large high-order nonlinearity. It is well
known that resolution can be enhanced with high-order nonlinearity. We will show
it in Sect. 10.4.
These results are depicted in terms of normalised scattering cross-section C sca
(representing the scattering ability of GNS) in Fig. 10.3b. At low intensity, C sca
is constant, that is linear response. In the SS and RSS regions, C sca reduces and
increases, respectively, that is transmission is enhanced and reduced, respectively.
This is similar to SA and RSA, suggesting similar underlying physical mechanism.
Additional verification is done by fitting the curve in Fig. 10.3a using a typical
nonlinear equation, I sca = αI + βI
2
+ γ I
3 , where α is linear and β, γ are nonlinear
scattering coefficients and a good match between the values of β/α and γ /α with the
same values derived from absorption-based experiment was noted.
Fig. 10.3 a Scattering intensity dependency from a single gold nanosphere under 561 nm excitation,
showing clear saturation of scattering (SS) and reverse saturation of scattering (RSS) behaviours.
The inset presents the emission spectrum, manifesting that only scattering signal is observed. b
Normalised scattering cross-section, which is unity at low intensity, reduces at SS region, and
increases above unity at RSS region. c Saturation intensity I S with different excitation wavelengths.
Reproduced from [24] with permission from American Chemical Society