

206
K. Fujita
field imaging along the direction parallel to the illumination line. The SIM strategy
can be applied to improve the resolution along the illumination line. The interference of two line-shaped foci produces structured line illumination for the resolution
improvement. Watanabe et al. demonstrated the improvement in the spatial resolution
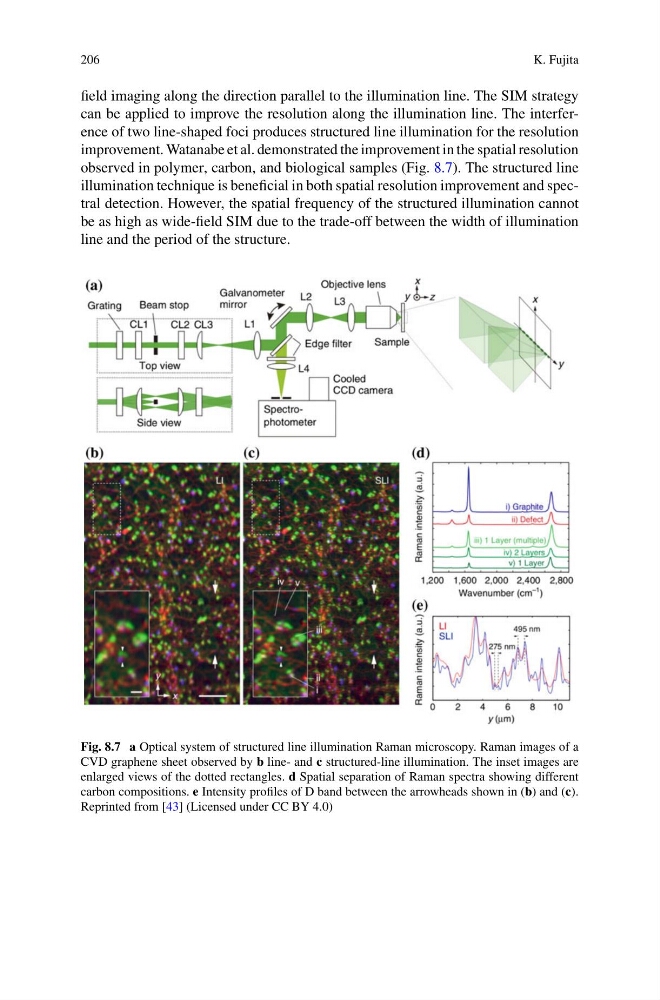
observed in polymer, carbon, and biological samples (Fig. 8.7). The structured line
illumination technique is beneficial in both spatial resolution improvement and spectral detection. However, the spatial frequency of the structured illumination cannot
be as high as wide-field SIM due to the trade-off between the width of illumination
line and the period of the structure.
Fig. 8.7 a Optical system of structured line illumination Raman microscopy. Raman images of a
CVD graphene sheet observed by b line- and c structured-line illumination. The inset images are
enlarged views of the dotted rectangles. d Spatial separation of Raman spectra showing different
carbon compositions. e Intensity profiles of D band between the arrowheads shown in (b) and (c).
Reprinted from [43] (Licensed under CC BY 4.0)
K. Fujita
field imaging along the direction parallel to the illumination line. The SIM strategy
can be applied to improve the resolution along the illumination line. The interference of two line-shaped foci produces structured line illumination for the resolution
improvement. Watanabe et al. demonstrated the improvement in the spatial resolution
observed in polymer, carbon, and biological samples (Fig. 8.7). The structured line
illumination technique is beneficial in both spatial resolution improvement and spectral detection. However, the spatial frequency of the structured illumination cannot
be as high as wide-field SIM due to the trade-off between the width of illumination
line and the period of the structure.
Fig. 8.7 a Optical system of structured line illumination Raman microscopy. Raman images of a
CVD graphene sheet observed by b line- and c structured-line illumination. The inset images are
enlarged views of the dotted rectangles. d Spatial separation of Raman spectra showing different
carbon compositions. e Intensity profiles of D band between the arrowheads shown in (b) and (c).
Reprinted from [43] (Licensed under CC BY 4.0)