

202
K. Fujita
Fig. 8.5 a SRS signal distribution across an edge of the diamond plate with and without decoherence
beam. b Bright field image of the diamond plate. c Variation in the spatial resolution with different
decoherence powers. d Line images of the diamond edge with and without decoherence beam. 800
nm pulsed laser light was used for pump and decoherence beams and focused by an objective lens
with an NA of 0.4. Reprinted with permission from ACS Photonics 3(1), 79–86 (2016). Copyright
2016 American Chemical Society
K. Fujita
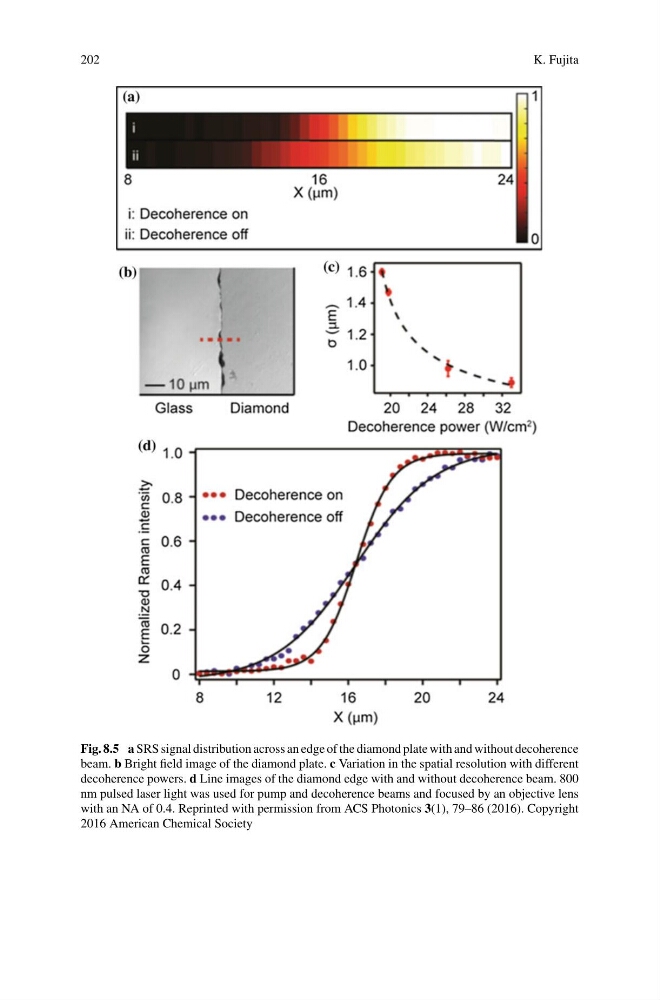
Fig. 8.5 a SRS signal distribution across an edge of the diamond plate with and without decoherence
beam. b Bright field image of the diamond plate. c Variation in the spatial resolution with different
decoherence powers. d Line images of the diamond edge with and without decoherence beam. 800
nm pulsed laser light was used for pump and decoherence beams and focused by an objective lens
with an NA of 0.4. Reprinted with permission from ACS Photonics 3(1), 79–86 (2016). Copyright
2016 American Chemical Society