

7 Label-Free Pump–Probe Nanoscopy
181
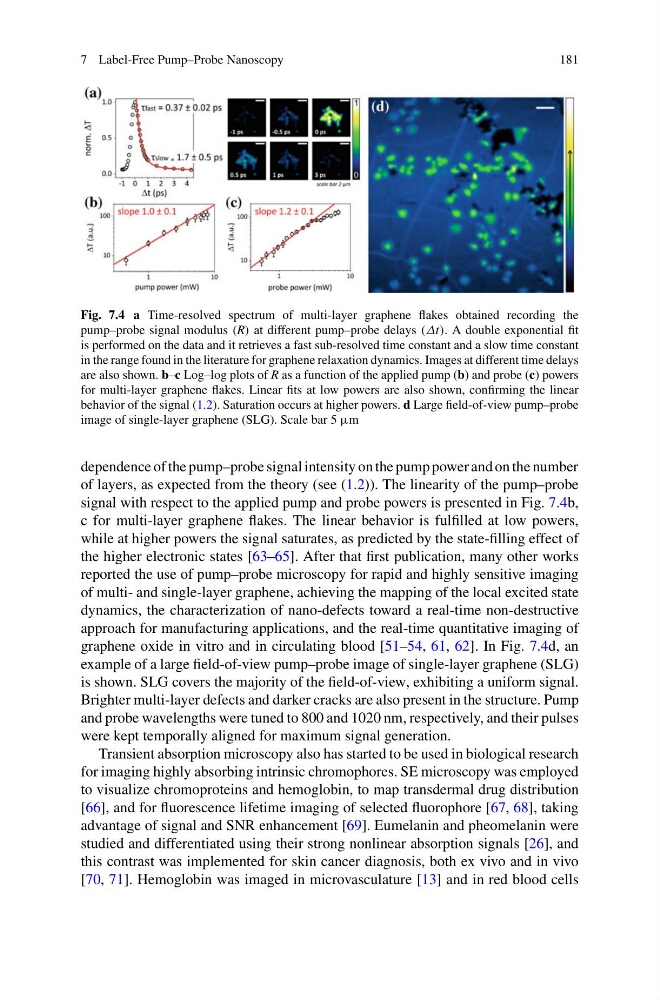
Fig. 7.4 a Time-resolved spectrum of multi-layer graphene flakes obtained recording the
pump–probe signal modulus (R) at different pump–probe delays (Δt). A double exponential fit
is performed on the data and it retrieves a fast sub-resolved time constant and a slow time constant
in the range found in the literature for graphene relaxation dynamics. Images at different time delays
are also shown. b–c Log–log plots of R as a function of the applied pump (b) and probe (c) powers
for multi-layer graphene flakes. Linear fits at low powers are also shown, confirming the linear
behavior of the signal (1.2). Saturation occurs at higher powers. d Large field-of-view pump–probe
image of single-layer graphene (SLG). Scale bar 5 μm
dependence of the pump–probe signal intensity on the pump power and on the number
of layers, as expected from the theory (see (1.2)). The linearity of the pump–probe
signal with respect to the applied pump and probe powers is presented in Fig. 7.4b,
c for multi-layer graphene flakes. The linear behavior is fulfilled at low powers,
while at higher powers the signal saturates, as predicted by the state-filling effect of
the higher electronic states [63–65]. After that first publication, many other works
reported the use of pump–probe microscopy for rapid and highly sensitive imaging
of multi- and single-layer graphene, achieving the mapping of the local excited state
dynamics, the characterization of nano-defects toward a real-time non-destructive
approach for manufacturing applications, and the real-time quantitative imaging of
graphene oxide in vitro and in circulating blood [51–54, 61, 62]. In Fig. 7.4d, an
example of a large field-of-view pump–probe image of single-layer graphene (SLG)
is shown. SLG covers the majority of the field-of-view, exhibiting a uniform signal.
Brighter multi-layer defects and darker cracks are also present in the structure. Pump
and probe wavelengths were tuned to 800 and 1020 nm, respectively, and their pulses
were kept temporally aligned for maximum signal generation.
Transient absorption microscopy also has started to be used in biological research
for imaging highly absorbing intrinsic chromophores. SE microscopy was employed
to visualize chromoproteins and hemoglobin, to map transdermal drug distribution
[66], and for fluorescence lifetime imaging of selected fluorophore [67, 68], taking
advantage of signal and SNR enhancement [69]. Eumelanin and pheomelanin were
studied and differentiated using their strong nonlinear absorption signals [26], and
this contrast was implemented for skin cancer diagnosis, both ex vivo and in vivo
[70, 71]. Hemoglobin was imaged in microvasculature [13] and in red blood cells
181
Fig. 7.4 a Time-resolved spectrum of multi-layer graphene flakes obtained recording the
pump–probe signal modulus (R) at different pump–probe delays (Δt). A double exponential fit
is performed on the data and it retrieves a fast sub-resolved time constant and a slow time constant
in the range found in the literature for graphene relaxation dynamics. Images at different time delays
are also shown. b–c Log–log plots of R as a function of the applied pump (b) and probe (c) powers
for multi-layer graphene flakes. Linear fits at low powers are also shown, confirming the linear
behavior of the signal (1.2). Saturation occurs at higher powers. d Large field-of-view pump–probe
image of single-layer graphene (SLG). Scale bar 5 μm
dependence of the pump–probe signal intensity on the pump power and on the number
of layers, as expected from the theory (see (1.2)). The linearity of the pump–probe
signal with respect to the applied pump and probe powers is presented in Fig. 7.4b,
c for multi-layer graphene flakes. The linear behavior is fulfilled at low powers,
while at higher powers the signal saturates, as predicted by the state-filling effect of
the higher electronic states [63–65]. After that first publication, many other works
reported the use of pump–probe microscopy for rapid and highly sensitive imaging
of multi- and single-layer graphene, achieving the mapping of the local excited state
dynamics, the characterization of nano-defects toward a real-time non-destructive
approach for manufacturing applications, and the real-time quantitative imaging of
graphene oxide in vitro and in circulating blood [51–54, 61, 62]. In Fig. 7.4d, an
example of a large field-of-view pump–probe image of single-layer graphene (SLG)
is shown. SLG covers the majority of the field-of-view, exhibiting a uniform signal.
Brighter multi-layer defects and darker cracks are also present in the structure. Pump
and probe wavelengths were tuned to 800 and 1020 nm, respectively, and their pulses
were kept temporally aligned for maximum signal generation.
Transient absorption microscopy also has started to be used in biological research
for imaging highly absorbing intrinsic chromophores. SE microscopy was employed
to visualize chromoproteins and hemoglobin, to map transdermal drug distribution
[66], and for fluorescence lifetime imaging of selected fluorophore [67, 68], taking
advantage of signal and SNR enhancement [69]. Eumelanin and pheomelanin were
studied and differentiated using their strong nonlinear absorption signals [26], and
this contrast was implemented for skin cancer diagnosis, both ex vivo and in vivo
[70, 71]. Hemoglobin was imaged in microvasculature [13] and in red blood cells