

160
C. Li and J.-X. Cheng
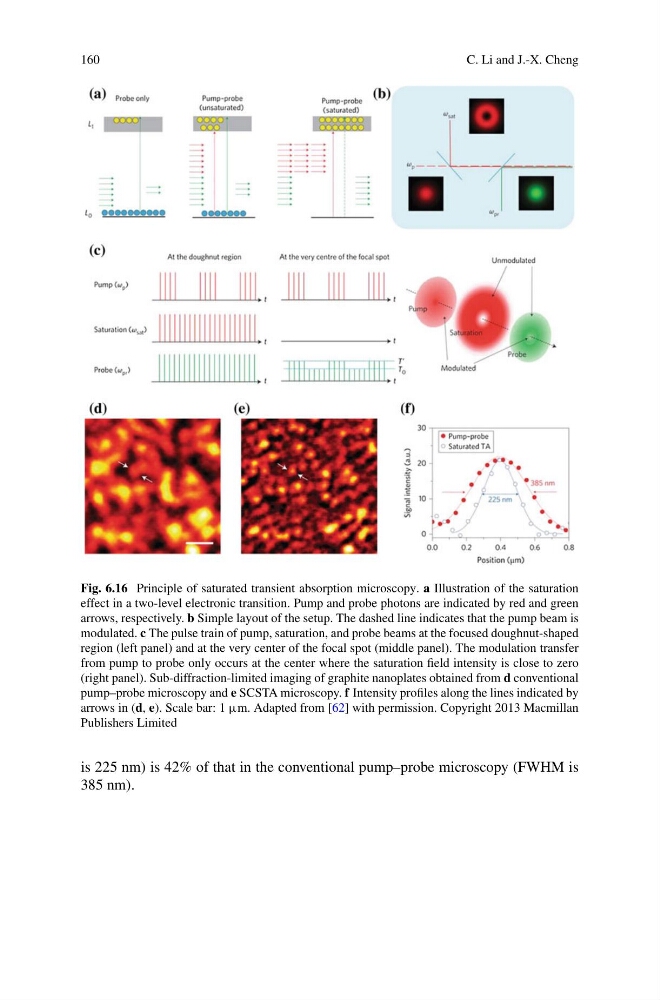
Fig. 6.16 Principle of saturated transient absorption microscopy. a Illustration of the saturation
effect in a two-level electronic transition. Pump and probe photons are indicated by red and green
arrows, respectively. b Simple layout of the setup. The dashed line indicates that the pump beam is
modulated. c The pulse train of pump, saturation, and probe beams at the focused doughnut-shaped
region (left panel) and at the very center of the focal spot (middle panel). The modulation transfer
from pump to probe only occurs at the center where the saturation field intensity is close to zero
(right panel). Sub-diffraction-limited imaging of graphite nanoplates obtained from d conventional
pump–probe microscopy and e SCSTA microscopy. f Intensity profiles along the lines indicated by
arrows in (d, e). Scale bar: 1 µm. Adapted from [62] with permission. Copyright 2013 Macmillan
Publishers Limited
is 225 nm) is 42% of that in the conventional pump–probe microscopy (FWHM is
385 nm).
C. Li and J.-X. Cheng
Fig. 6.16 Principle of saturated transient absorption microscopy. a Illustration of the saturation
effect in a two-level electronic transition. Pump and probe photons are indicated by red and green
arrows, respectively. b Simple layout of the setup. The dashed line indicates that the pump beam is
modulated. c The pulse train of pump, saturation, and probe beams at the focused doughnut-shaped
region (left panel) and at the very center of the focal spot (middle panel). The modulation transfer
from pump to probe only occurs at the center where the saturation field intensity is close to zero
(right panel). Sub-diffraction-limited imaging of graphite nanoplates obtained from d conventional
pump–probe microscopy and e SCSTA microscopy. f Intensity profiles along the lines indicated by
arrows in (d, e). Scale bar: 1 µm. Adapted from [62] with permission. Copyright 2013 Macmillan
Publishers Limited
is 225 nm) is 42% of that in the conventional pump–probe microscopy (FWHM is
385 nm).