

82
L. E. Bilston
McElhaney (an order of magnitude higher at 1000/s, not shown), which suggests
that the strain-rate sensitivity does not disappear, even at very high loading rates.
Data is reported for peak strains up to 30–50% in compression, suggesting this is the
onset of failure. Rashid et al. [56] observed strain-rate effects at compressive strain
rates of 30–90/s also. None of these studies explicitly considered inertial effects,
which can be expected to be significant.
Traditional rheological test protocols have rarely been applied to compression
testing, and thus the linear viscoelastic properties of brain in compression have
not been ascertained. Fallenstein et al. used sinusoidal indentation tests in the live
macaque brain and showed that for very small indentations (25 μm) the force
response was sinusoidal, suggesting linear response, but for larger indentations
(300 μm) the responses were non-sinusoidal. The linear limit may lie between these
two, but the local strain field is difficult to estimate, especially since the pia mater
was intact underneath the probe, and thus these data do not give a clear value for
the compressive linear viscoelastic strain limit, although it is likely to be quite low.
Miller et al. [57] indented porcine brain in vivo, using a finite element model to
extract parameters for a hyper-viscoelastic constitutive model.
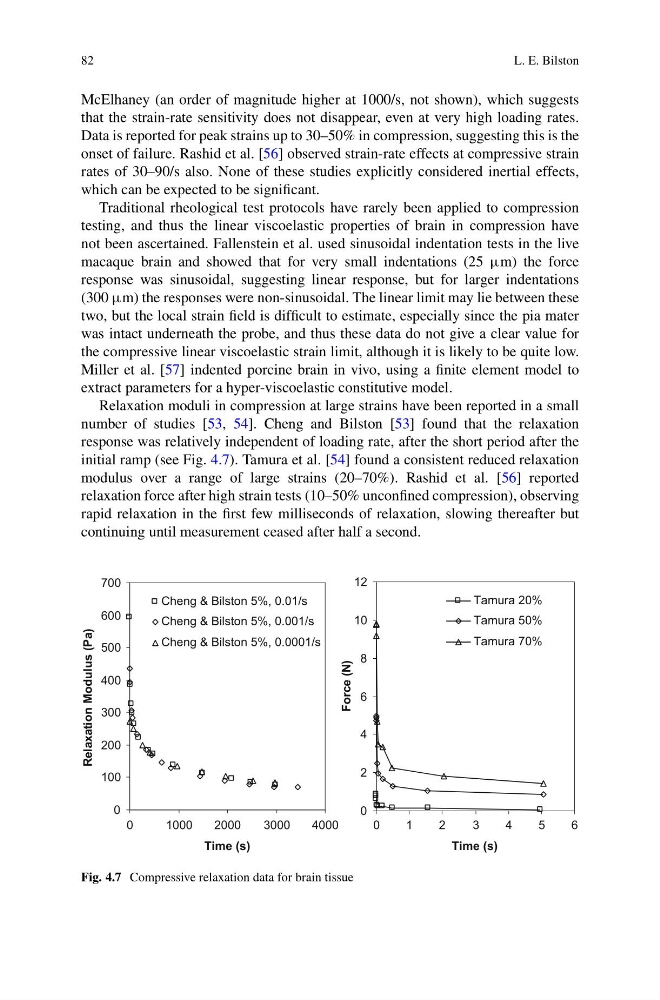
Relaxation moduli in compression at large strains have been reported in a small
number of studies [53, 54]. Cheng and Bilston [53] found that the relaxation
response was relatively independent of loading rate, after the short period after the
initial ramp (see Fig. 4.7). Tamura et al. [54] found a consistent reduced relaxation
modulus over a range of large strains (20–70%). Rashid et al. [56] reported
relaxation force after high strain tests (10–50% unconfined compression), observing
rapid relaxation in the first few milliseconds of relaxation, slowing thereafter but
continuing until measurement ceased after half a second.
0
100
200
300
400
500
600
700
0
1000
2000
3000
4000
Time (s)
)
a
P
(
s
u
l
u
d
o
M
n
o
i
t
a
x
a
l
e
R
Cheng & Bilston 5%, 0.01/s
Cheng & Bilston 5%, 0.001/s
Cheng & Bilston 5%, 0.0001/s
0
2
4
6
8
10
12
0
1
2
3
4
5
6
Time (s)
)
N
(
e
c
r
o
F
Tamura 20%
Tamura 50%
Tamura 70%
Fig. 4.7 Compressive relaxation data for brain tissue
L. E. Bilston
McElhaney (an order of magnitude higher at 1000/s, not shown), which suggests
that the strain-rate sensitivity does not disappear, even at very high loading rates.
Data is reported for peak strains up to 30–50% in compression, suggesting this is the
onset of failure. Rashid et al. [56] observed strain-rate effects at compressive strain
rates of 30–90/s also. None of these studies explicitly considered inertial effects,
which can be expected to be significant.
Traditional rheological test protocols have rarely been applied to compression
testing, and thus the linear viscoelastic properties of brain in compression have
not been ascertained. Fallenstein et al. used sinusoidal indentation tests in the live
macaque brain and showed that for very small indentations (25 μm) the force
response was sinusoidal, suggesting linear response, but for larger indentations
(300 μm) the responses were non-sinusoidal. The linear limit may lie between these
two, but the local strain field is difficult to estimate, especially since the pia mater
was intact underneath the probe, and thus these data do not give a clear value for
the compressive linear viscoelastic strain limit, although it is likely to be quite low.
Miller et al. [57] indented porcine brain in vivo, using a finite element model to
extract parameters for a hyper-viscoelastic constitutive model.
Relaxation moduli in compression at large strains have been reported in a small
number of studies [53, 54]. Cheng and Bilston [53] found that the relaxation
response was relatively independent of loading rate, after the short period after the
initial ramp (see Fig. 4.7). Tamura et al. [54] found a consistent reduced relaxation
modulus over a range of large strains (20–70%). Rashid et al. [56] reported
relaxation force after high strain tests (10–50% unconfined compression), observing
rapid relaxation in the first few milliseconds of relaxation, slowing thereafter but
continuing until measurement ceased after half a second.
0
100
200
300
400
500
600
700
0
1000
2000
3000
4000
Time (s)
)
a
P
(
s
u
l
u
d
o
M
n
o
i
t
a
x
a
l
e
R
Cheng & Bilston 5%, 0.01/s
Cheng & Bilston 5%, 0.001/s
Cheng & Bilston 5%, 0.0001/s
0
2
4
6
8
10
12
0
1
2
3
4
5
6
Time (s)
)
N
(
e
c
r
o
F
Tamura 20%
Tamura 50%
Tamura 70%
Fig. 4.7 Compressive relaxation data for brain tissue