

4 Brain Tissue Mechanical Properties
79
loading cycle, and thus more rheologically rigorous methodologies can, and should,
be applied to study oscillatory loading of brain tissue, to better characterise not
only the fully nonlinear behaviour but also the transition regime between 0.1% and
1% strain just above the linear viscoelastic limit. Newer methods such as applying
large amplitude oscillatory shear and using shear in combination with other loading
conditions [46] in which inertial effects are properly considered, may also be useful
for brain tissue.
4.2.2.2 Relaxation
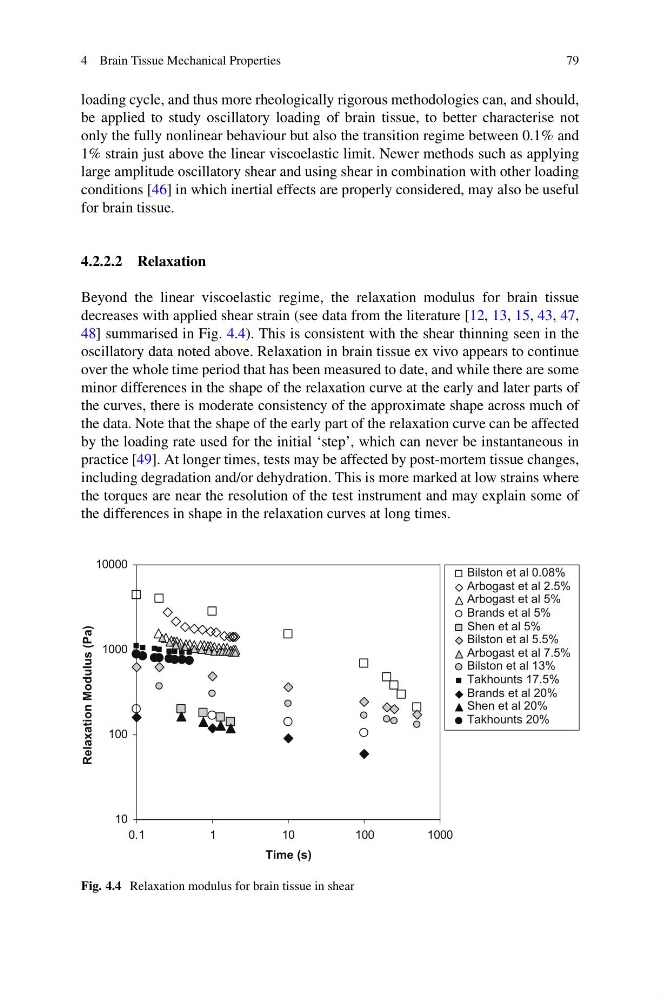
Beyond the linear viscoelastic regime, the relaxation modulus for brain tissue
decreases with applied shear strain (see data from the literature [12, 13, 15, 43, 47,
48] summarised in Fig. 4.4). This is consistent with the shear thinning seen in the
oscillatory data noted above. Relaxation in brain tissue ex vivo appears to continue
over the whole time period that has been measured to date, and while there are some
minor differences in the shape of the relaxation curve at the early and later parts of
the curves, there is moderate consistency of the approximate shape across much of
the data. Note that the shape of the early part of the relaxation curve can be affected
by the loading rate used for the initial ‘step’, which can never be instantaneous in
practice [49]. At longer times, tests may be affected by post-mortem tissue changes,
including degradation and/or dehydration. This is more marked at low strains where
the torques are near the resolution of the test instrument and may explain some of
the differences in shape in the relaxation curves at long times.
10
100
1000
10000
0.1
1
10
100
1000
Time (s)
Relaxation Modulus (Pa)
Bilston et al 0.08%
Arbogast et al 2.5%
Arbogast et al 5%
Brands et al 5%
Shen et al 5%
Bilston et al 5.5%
Arbogast et al 7.5%
Bilston et al 13%
Takhounts 17.5%
Brands et al 20%
Shen et al 20%
Takhounts 20%
Fig. 4.4 Relaxation modulus for brain tissue in shear
79
loading cycle, and thus more rheologically rigorous methodologies can, and should,
be applied to study oscillatory loading of brain tissue, to better characterise not
only the fully nonlinear behaviour but also the transition regime between 0.1% and
1% strain just above the linear viscoelastic limit. Newer methods such as applying
large amplitude oscillatory shear and using shear in combination with other loading
conditions [46] in which inertial effects are properly considered, may also be useful
for brain tissue.
4.2.2.2 Relaxation
Beyond the linear viscoelastic regime, the relaxation modulus for brain tissue
decreases with applied shear strain (see data from the literature [12, 13, 15, 43, 47,
48] summarised in Fig. 4.4). This is consistent with the shear thinning seen in the
oscillatory data noted above. Relaxation in brain tissue ex vivo appears to continue
over the whole time period that has been measured to date, and while there are some
minor differences in the shape of the relaxation curve at the early and later parts of
the curves, there is moderate consistency of the approximate shape across much of
the data. Note that the shape of the early part of the relaxation curve can be affected
by the loading rate used for the initial ‘step’, which can never be instantaneous in
practice [49]. At longer times, tests may be affected by post-mortem tissue changes,
including degradation and/or dehydration. This is more marked at low strains where
the torques are near the resolution of the test instrument and may explain some of
the differences in shape in the relaxation curves at long times.
10
100
1000
10000
0.1
1
10
100
1000
Time (s)
Relaxation Modulus (Pa)
Bilston et al 0.08%
Arbogast et al 2.5%
Arbogast et al 5%
Brands et al 5%
Shen et al 5%
Bilston et al 5.5%
Arbogast et al 7.5%
Bilston et al 13%
Takhounts 17.5%
Brands et al 20%
Shen et al 20%
Takhounts 20%
Fig. 4.4 Relaxation modulus for brain tissue in shear