

4 Brain Tissue Mechanical Properties
75
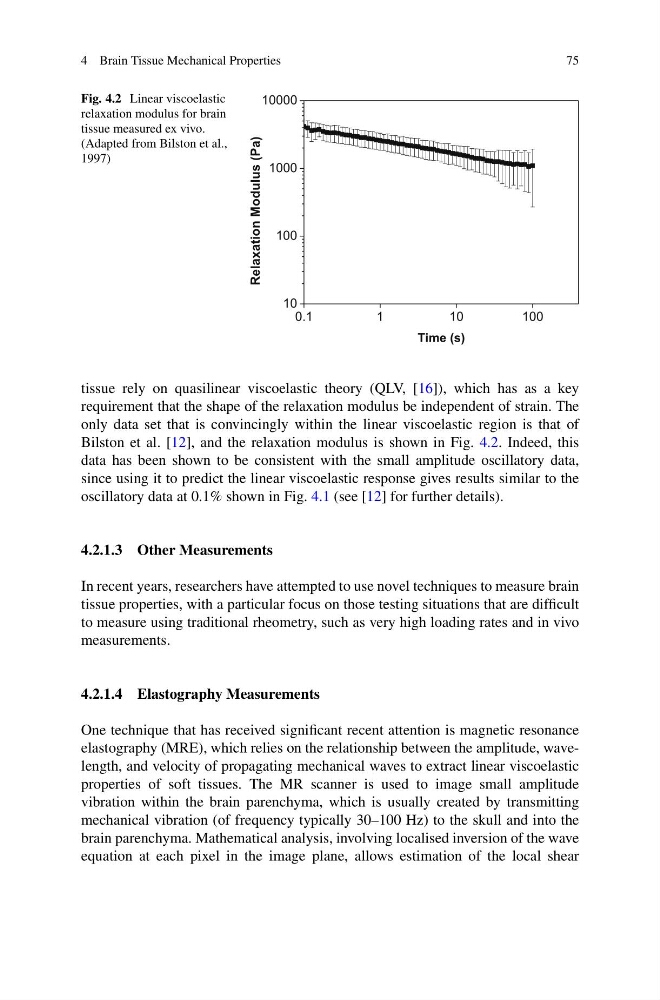
Fig. 4.2 Linear viscoelastic
relaxation modulus for brain
tissue measured ex vivo.
(Adapted from Bilston et al.,
1997)
0.1
1
10
100
10
100
1000
10000
)
a
P
(
s
u
l
u
d
o
M
n
o
i
t
a
x
a
l
e
R
Time (s)
tissue rely on quasilinear viscoelastic theory (QLV, [16]), which has as a key
requirement that the shape of the relaxation modulus be independent of strain. The
only data set that is convincingly within the linear viscoelastic region is that of
Bilston et al. [12], and the relaxation modulus is shown in Fig. 4.2. Indeed, this
data has been shown to be consistent with the small amplitude oscillatory data,
since using it to predict the linear viscoelastic response gives results similar to the
oscillatory data at 0.1% shown in Fig. 4.1 (see [12] for further details).
4.2.1.3 Other Measurements
In recent years, researchers have attempted to use novel techniques to measure brain
tissue properties, with a particular focus on those testing situations that are difficult
to measure using traditional rheometry, such as very high loading rates and in vivo
measurements.
4.2.1.4 Elastography Measurements
One technique that has received significant recent attention is magnetic resonance
elastography (MRE), which relies on the relationship between the amplitude, wavelength, and velocity of propagating mechanical waves to extract linear viscoelastic
properties of soft tissues. The MR scanner is used to image small amplitude
vibration within the brain parenchyma, which is usually created by transmitting
mechanical vibration (of frequency typically 30–100 Hz) to the skull and into the
brain parenchyma. Mathematical analysis, involving localised inversion of the wave
equation at each pixel in the image plane, allows estimation of the local shear
75
Fig. 4.2 Linear viscoelastic
relaxation modulus for brain
tissue measured ex vivo.
(Adapted from Bilston et al.,
1997)
0.1
1
10
100
10
100
1000
10000
)
a
P
(
s
u
l
u
d
o
M
n
o
i
t
a
x
a
l
e
R
Time (s)
tissue rely on quasilinear viscoelastic theory (QLV, [16]), which has as a key
requirement that the shape of the relaxation modulus be independent of strain. The
only data set that is convincingly within the linear viscoelastic region is that of
Bilston et al. [12], and the relaxation modulus is shown in Fig. 4.2. Indeed, this
data has been shown to be consistent with the small amplitude oscillatory data,
since using it to predict the linear viscoelastic response gives results similar to the
oscillatory data at 0.1% shown in Fig. 4.1 (see [12] for further details).
4.2.1.3 Other Measurements
In recent years, researchers have attempted to use novel techniques to measure brain
tissue properties, with a particular focus on those testing situations that are difficult
to measure using traditional rheometry, such as very high loading rates and in vivo
measurements.
4.2.1.4 Elastography Measurements
One technique that has received significant recent attention is magnetic resonance
elastography (MRE), which relies on the relationship between the amplitude, wavelength, and velocity of propagating mechanical waves to extract linear viscoelastic
properties of soft tissues. The MR scanner is used to image small amplitude
vibration within the brain parenchyma, which is usually created by transmitting
mechanical vibration (of frequency typically 30–100 Hz) to the skull and into the
brain parenchyma. Mathematical analysis, involving localised inversion of the wave
equation at each pixel in the image plane, allows estimation of the local shear