

192
L. Geregele et al.
17.05
16
ICP
[mm Hg]
ABP
[mm Hg]
FV
[cm/s]
Hb
[µmol/L]
TIME [h:m]
15
14
13
12
11
10
9
8
90
85
80
75
70
65
60
55
40
35
30
25
20
-2
-3
-4
-5
17.10
17.15
17.20
17.25
17.30
17.35
17.40
17.45
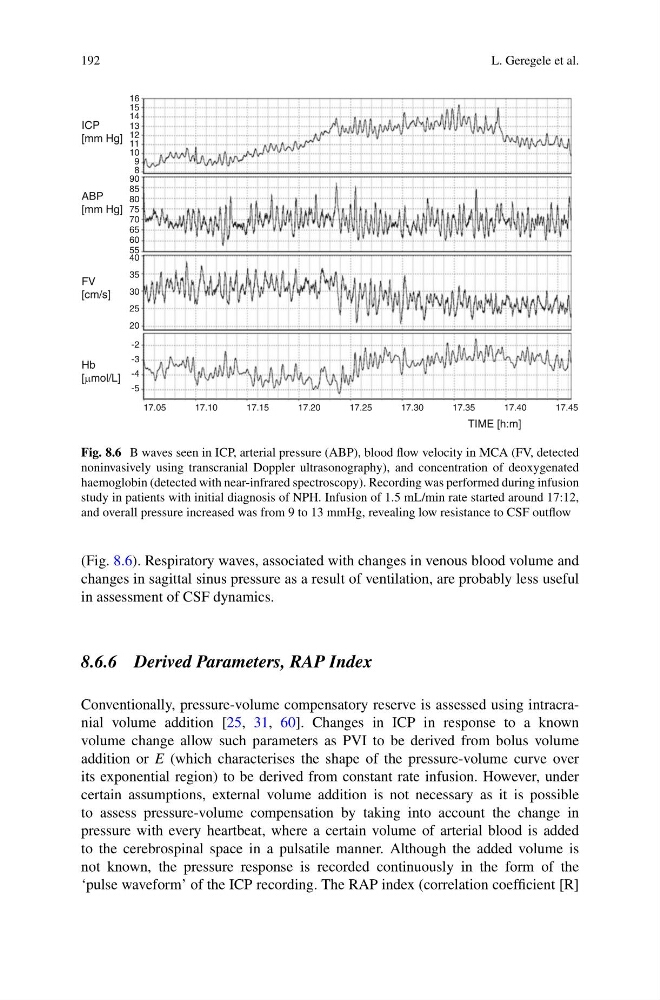
Fig. 8.6 B waves seen in ICP, arterial pressure (ABP), blood flow velocity in MCA (FV, detected
noninvasively using transcranial Doppler ultrasonography), and concentration of deoxygenated
haemoglobin (detected with near-infrared spectroscopy). Recording was performed during infusion
study in patients with initial diagnosis of NPH. Infusion of 1.5 mL/min rate started around 17:12,
and overall pressure increased was from 9 to 13 mmHg, revealing low resistance to CSF outflow
(Fig. 8.6). Respiratory waves, associated with changes in venous blood volume and
changes in sagittal sinus pressure as a result of ventilation, are probably less useful
in assessment of CSF dynamics.
8.6.6 Derived Parameters, RAP Index
Conventionally, pressure-volume compensatory reserve is assessed using intracranial volume addition [25, 31, 60]. Changes in ICP in response to a known
volume change allow such parameters as PVI to be derived from bolus volume
addition or E (which characterises the shape of the pressure-volume curve over
its exponential region) to be derived from constant rate infusion. However, under
certain assumptions, external volume addition is not necessary as it is possible
to assess pressure-volume compensation by taking into account the change in
pressure with every heartbeat, where a certain volume of arterial blood is added
to the cerebrospinal space in a pulsatile manner. Although the added volume is
not known, the pressure response is recorded continuously in the form of the
‘pulse waveform’ of the ICP recording. The RAP index (correlation coefficient [R]
L. Geregele et al.
17.05
16
ICP
[mm Hg]
ABP
[mm Hg]
FV
[cm/s]
Hb
[µmol/L]
TIME [h:m]
15
14
13
12
11
10
9
8
90
85
80
75
70
65
60
55
40
35
30
25
20
-2
-3
-4
-5
17.10
17.15
17.20
17.25
17.30
17.35
17.40
17.45
Fig. 8.6 B waves seen in ICP, arterial pressure (ABP), blood flow velocity in MCA (FV, detected
noninvasively using transcranial Doppler ultrasonography), and concentration of deoxygenated
haemoglobin (detected with near-infrared spectroscopy). Recording was performed during infusion
study in patients with initial diagnosis of NPH. Infusion of 1.5 mL/min rate started around 17:12,
and overall pressure increased was from 9 to 13 mmHg, revealing low resistance to CSF outflow
(Fig. 8.6). Respiratory waves, associated with changes in venous blood volume and
changes in sagittal sinus pressure as a result of ventilation, are probably less useful
in assessment of CSF dynamics.
8.6.6 Derived Parameters, RAP Index
Conventionally, pressure-volume compensatory reserve is assessed using intracranial volume addition [25, 31, 60]. Changes in ICP in response to a known
volume change allow such parameters as PVI to be derived from bolus volume
addition or E (which characterises the shape of the pressure-volume curve over
its exponential region) to be derived from constant rate infusion. However, under
certain assumptions, external volume addition is not necessary as it is possible
to assess pressure-volume compensation by taking into account the change in
pressure with every heartbeat, where a certain volume of arterial blood is added
to the cerebrospinal space in a pulsatile manner. Although the added volume is
not known, the pressure response is recorded continuously in the form of the
‘pulse waveform’ of the ICP recording. The RAP index (correlation coefficient [R]