

190
L. Geregele et al.
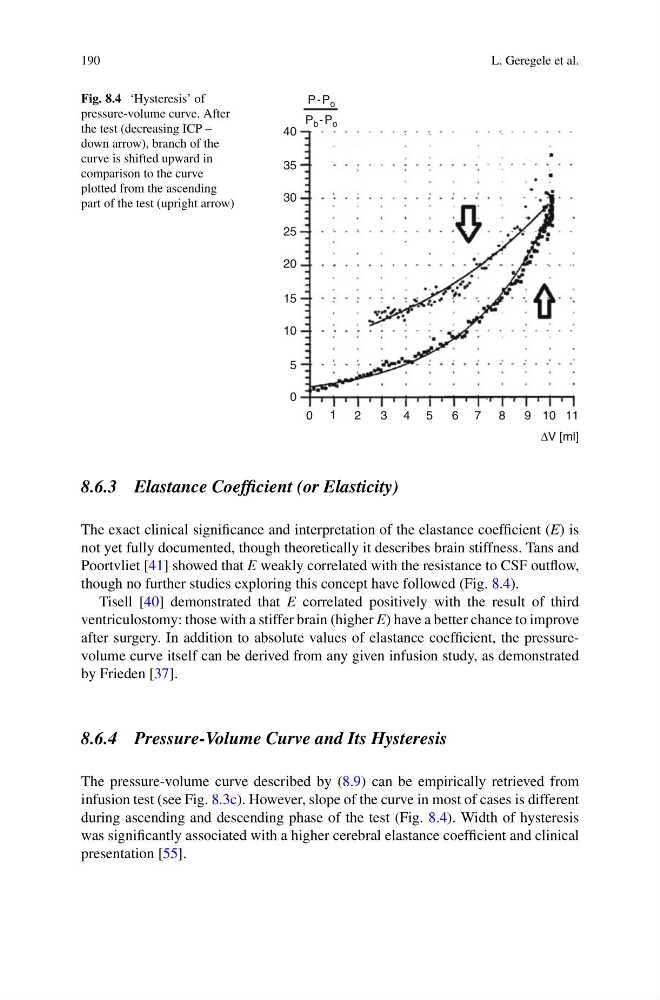
Fig. 8.4 ‘Hysteresis’ of
pressure-volume curve. After
the test (decreasing ICP –
down arrow), branch of the
curve is shifted upward in
comparison to the curve
plotted from the ascending
part of the test (upright arrow)
40
35
30
25
20
15
10
5
0
0 1 2
3 4 5
6 7 8
9 10
ΔV [ml]
11
P-P o
P b -P o
8.6.3 Elastance Coefficient (or Elasticity)
The exact clinical significance and interpretation of the elastance coefficient (E) is
not yet fully documented, though theoretically it describes brain stiffness. Tans and
Poortvliet [41] showed that E weakly correlated with the resistance to CSF outflow,
though no further studies exploring this concept have followed (Fig. 8.4).
Tisell [40] demonstrated that E correlated positively with the result of third
ventriculostomy: those with a stiffer brain (higher E) have a better chance to improve
after surgery. In addition to absolute values of elastance coefficient, the pressurevolume curve itself can be derived from any given infusion study, as demonstrated
by Frieden [37].
8.6.4 Pressure-Volume Curve and Its Hysteresis
The pressure-volume curve described by (8.9) can be empirically retrieved from
infusion test (see Fig. 8.3c). However, slope of the curve in most of cases is different
during ascending and descending phase of the test (Fig. 8.4). Width of hysteresis
was significantly associated with a higher cerebral elastance coefficient and clinical
presentation [55].
L. Geregele et al.
Fig. 8.4 ‘Hysteresis’ of
pressure-volume curve. After
the test (decreasing ICP –
down arrow), branch of the
curve is shifted upward in
comparison to the curve
plotted from the ascending
part of the test (upright arrow)
40
35
30
25
20
15
10
5
0
0 1 2
3 4 5
6 7 8
9 10
ΔV [ml]
11
P-P o
P b -P o
8.6.3 Elastance Coefficient (or Elasticity)
The exact clinical significance and interpretation of the elastance coefficient (E) is
not yet fully documented, though theoretically it describes brain stiffness. Tans and
Poortvliet [41] showed that E weakly correlated with the resistance to CSF outflow,
though no further studies exploring this concept have followed (Fig. 8.4).
Tisell [40] demonstrated that E correlated positively with the result of third
ventriculostomy: those with a stiffer brain (higher E) have a better chance to improve
after surgery. In addition to absolute values of elastance coefficient, the pressurevolume curve itself can be derived from any given infusion study, as demonstrated
by Frieden [37].
8.6.4 Pressure-Volume Curve and Its Hysteresis
The pressure-volume curve described by (8.9) can be empirically retrieved from
infusion test (see Fig. 8.3c). However, slope of the curve in most of cases is different
during ascending and descending phase of the test (Fig. 8.4). Width of hysteresis
was significantly associated with a higher cerebral elastance coefficient and clinical
presentation [55].