

8 Dynamics of Cerebrospinal Fluid: From Theoretical Models to Clinical Applications
187
P (t) =
I inf +
p b −p o
R
· [p b − p o ]
p b −p o
R
+ I inf ·
e
−E
p b −po
R +I inf
·t
+ p o
(8.6)
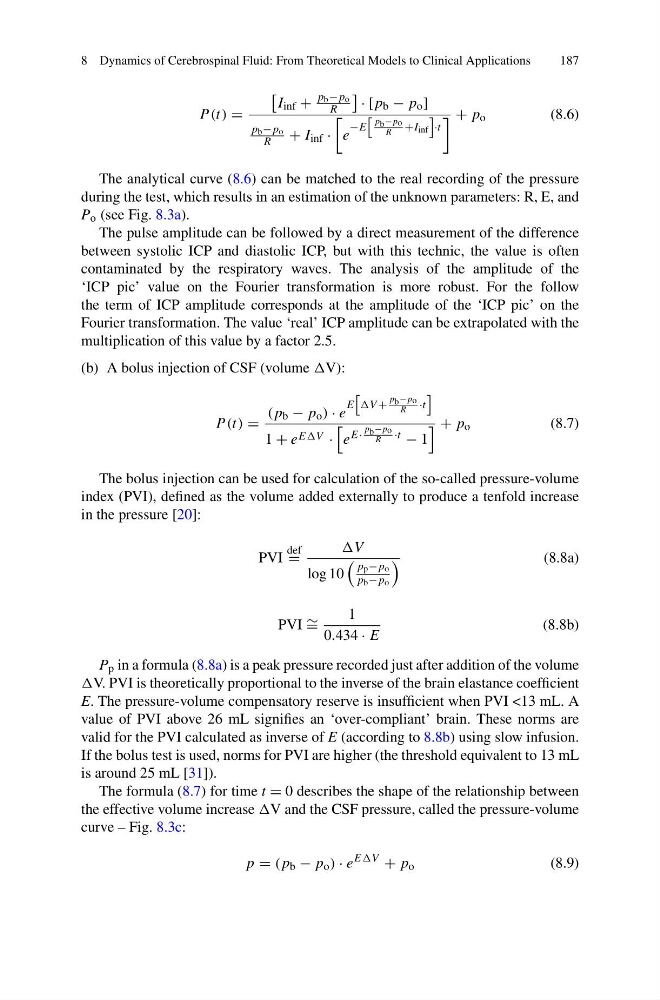
The analytical curve (8.6) can be matched to the real recording of the pressure
during the test, which results in an estimation of the unknown parameters: R, E, and
P o (see Fig. 8.3a).
The pulse amplitude can be followed by a direct measurement of the difference
between systolic ICP and diastolic ICP, but with this technic, the value is often
contaminated by the respiratory waves. The analysis of the amplitude of the
‘ICP pic’ value on the Fourier transformation is more robust. For the follow
the term of ICP amplitude corresponds at the amplitude of the ‘ICP pic’ on the
Fourier transformation. The value ‘real’ ICP amplitude can be extrapolated with the
multiplication of this value by a factor 2.5.
(b) A bolus injection of CSF (volume V):
P (t) =
(p b − p o ) · e
E
V +
p b −po
R ·t
1 + e EEV ·
e
E·
p b −po
R ·t
− 1
+ p o
(8.7)
The bolus injection can be used for calculation of the so-called pressure-volume
index (PVI), defined as the volume added externally to produce a tenfold increase
in the pressure [20]:
PVI
def
=
V
log 10
p p −p o
p b −p o
(8.8a)
PVI ∼ =
1
0.434 · E
(8.8b)
P p in a formula (8.8a) is a peak pressure recorded just after addition of the volume
V. PVI is theoretically proportional to the inverse of the brain elastance coefficient
E. The pressure-volume compensatory reserve is insufficient when PVI <13 mL. A
value of PVI above 26 mL signifies an ‘over-compliant’ brain. These norms are
valid for the PVI calculated as inverse of E (according to 8.8b) using slow infusion.
If the bolus test is used, norms for PVI are higher (the threshold equivalent to 13 mL
is around 25 mL [31]).
The formula (8.7) for time t = 0 describes the shape of the relationship between
the effective volume increase V and the CSF pressure, called the pressure-volume
curve – Fig. 8.3c:
p = (p b − p o ) · e
EEV
+ p o
(8.9)
187
P (t) =
I inf +
p b −p o
R
· [p b − p o ]
p b −p o
R
+ I inf ·
e
−E
p b −po
R +I inf
·t
+ p o
(8.6)
The analytical curve (8.6) can be matched to the real recording of the pressure
during the test, which results in an estimation of the unknown parameters: R, E, and
P o (see Fig. 8.3a).
The pulse amplitude can be followed by a direct measurement of the difference
between systolic ICP and diastolic ICP, but with this technic, the value is often
contaminated by the respiratory waves. The analysis of the amplitude of the
‘ICP pic’ value on the Fourier transformation is more robust. For the follow
the term of ICP amplitude corresponds at the amplitude of the ‘ICP pic’ on the
Fourier transformation. The value ‘real’ ICP amplitude can be extrapolated with the
multiplication of this value by a factor 2.5.
(b) A bolus injection of CSF (volume V):
P (t) =
(p b − p o ) · e
E
V +
p b −po
R ·t
1 + e EEV ·
e
E·
p b −po
R ·t
− 1
+ p o
(8.7)
The bolus injection can be used for calculation of the so-called pressure-volume
index (PVI), defined as the volume added externally to produce a tenfold increase
in the pressure [20]:
PVI
def
=
V
log 10
p p −p o
p b −p o
(8.8a)
PVI ∼ =
1
0.434 · E
(8.8b)
P p in a formula (8.8a) is a peak pressure recorded just after addition of the volume
V. PVI is theoretically proportional to the inverse of the brain elastance coefficient
E. The pressure-volume compensatory reserve is insufficient when PVI <13 mL. A
value of PVI above 26 mL signifies an ‘over-compliant’ brain. These norms are
valid for the PVI calculated as inverse of E (according to 8.8b) using slow infusion.
If the bolus test is used, norms for PVI are higher (the threshold equivalent to 13 mL
is around 25 mL [31]).
The formula (8.7) for time t = 0 describes the shape of the relationship between
the effective volume increase V and the CSF pressure, called the pressure-volume
curve – Fig. 8.3c:
p = (p b − p o ) · e
EEV
+ p o
(8.9)