

186
L. Geregele et al.
Formation of
CSF
Intracranial
pressure P
Resistance
to CSF
outflow
Pss
Po
Compliance
of CSF
space
Fig. 8.2 Electrical model of CSF circulation. Current source represents production of CSF,
resistor, and diode – unilateral absorption to sagittal sinus (voltage source P ss represents sagittal
sinus pressure). Capacitor – nonlinear compliance of CSF space
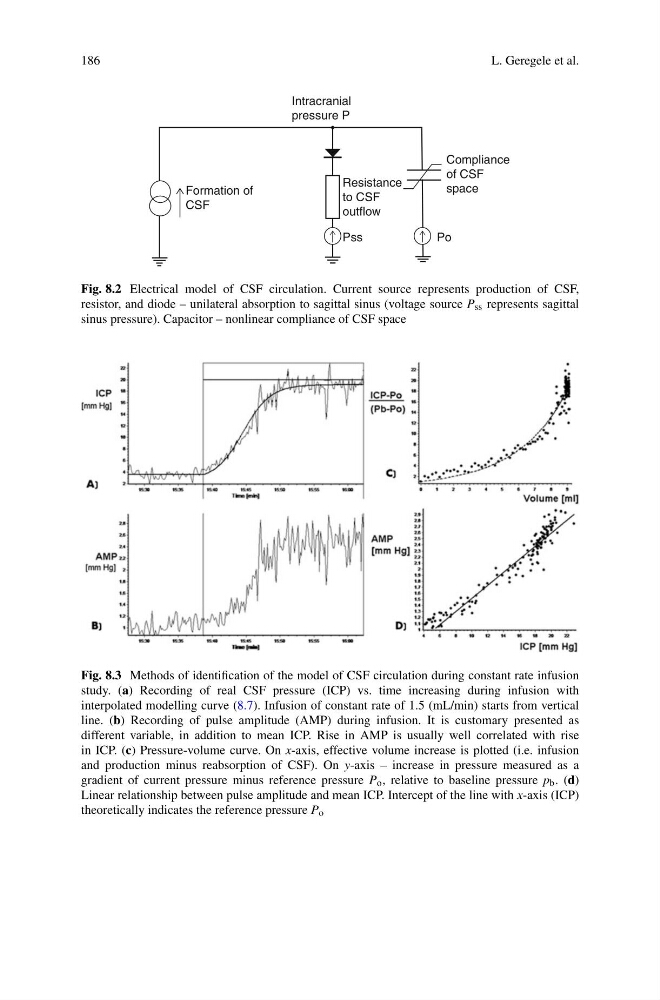
Fig. 8.3 Methods of identification of the model of CSF circulation during constant rate infusion
study. (a) Recording of real CSF pressure (ICP) vs. time increasing during infusion with
interpolated modelling curve (8.7). Infusion of constant rate of 1.5 (mL/min) starts from vertical
line. (b) Recording of pulse amplitude (AMP) during infusion. It is customary presented as
different variable, in addition to mean ICP. Rise in AMP is usually well correlated with rise
in ICP. (c) Pressure-volume curve. On x-axis, effective volume increase is plotted (i.e. infusion
and production minus reabsorption of CSF). On y-axis – increase in pressure measured as a
gradient of current pressure minus reference pressure P o , relative to baseline pressure p b . (d)
Linear relationship between pulse amplitude and mean ICP. Intercept of the line with x-axis (ICP)
theoretically indicates the reference pressure P o
L. Geregele et al.
Formation of
CSF
Intracranial
pressure P
Resistance
to CSF
outflow
Pss
Po
Compliance
of CSF
space
Fig. 8.2 Electrical model of CSF circulation. Current source represents production of CSF,
resistor, and diode – unilateral absorption to sagittal sinus (voltage source P ss represents sagittal
sinus pressure). Capacitor – nonlinear compliance of CSF space
Fig. 8.3 Methods of identification of the model of CSF circulation during constant rate infusion
study. (a) Recording of real CSF pressure (ICP) vs. time increasing during infusion with
interpolated modelling curve (8.7). Infusion of constant rate of 1.5 (mL/min) starts from vertical
line. (b) Recording of pulse amplitude (AMP) during infusion. It is customary presented as
different variable, in addition to mean ICP. Rise in AMP is usually well correlated with rise
in ICP. (c) Pressure-volume curve. On x-axis, effective volume increase is plotted (i.e. infusion
and production minus reabsorption of CSF). On y-axis – increase in pressure measured as a
gradient of current pressure minus reference pressure P o , relative to baseline pressure p b . (d)
Linear relationship between pulse amplitude and mean ICP. Intercept of the line with x-axis (ICP)
theoretically indicates the reference pressure P o