

187
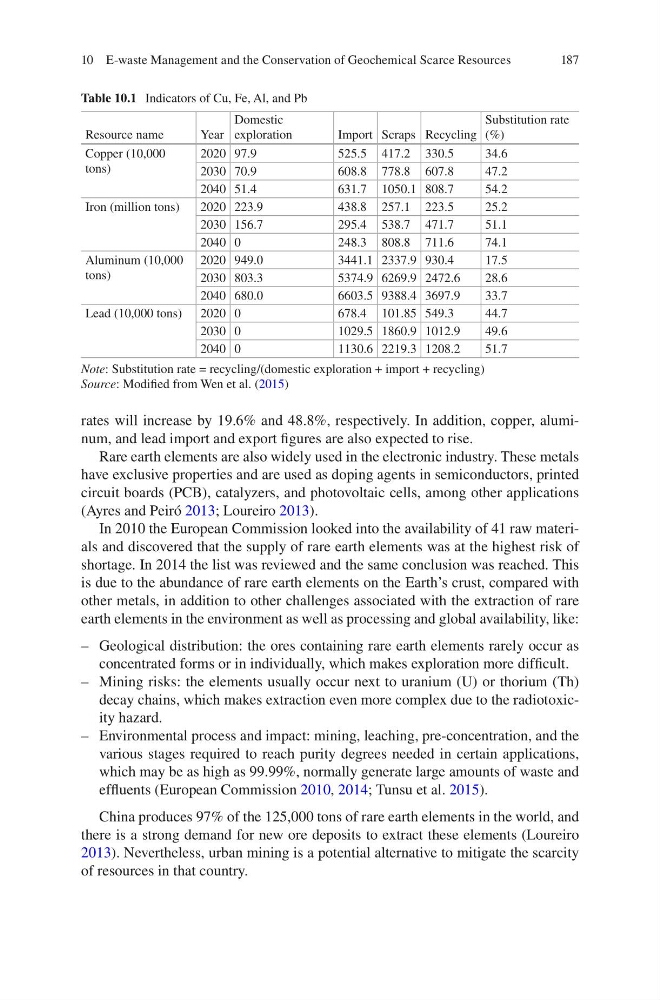
rates will increase by 19.6% and 48.8%, respectively. In addition, copper, aluminum, and lead import and export figures are also expected to rise.
Rare earth elements are also widely used in the electronic industry. These metals
have exclusive properties and are used as doping agents in semiconductors, printed
circuit boards (PCB), catalyzers, and photovoltaic cells, among other applications
(Ayres and Peiró 2013; Loureiro 2013).
In 2010 the European Commission looked into the availability of 41 raw materials and discovered that the supply of rare earth elements was at the highest risk of
shortage. In 2014 the list was reviewed and the same conclusion was reached. This
is due to the abundance of rare earth elements on the Earth’s crust, compared with
other metals, in addition to other challenges associated with the extraction of rare
earth elements in the environment as well as processing and global availability, like:
– Geological distribution: the ores containing rare earth elements rarely occur as
concentrated forms or in individually, which makes exploration more difficult.
– Mining risks: the elements usually occur next to uranium (U) or thorium (Th)
decay chains, which makes extraction even more complex due to the radiotoxicity hazard.
– Environmental process and impact: mining, leaching, pre-concentration, and the
various stages required to reach purity degrees needed in certain applications,
which may be as high as 99.99%, normally generate large amounts of waste and
effluents (European Commission 2010, 2014; Tunsu et al. 2015).
China produces 97% of the 125,000 tons of rare earth elements in the world, and
there is a strong demand for new ore deposits to extract these elements (Loureiro
2013). Nevertheless, urban mining is a potential alternative to mitigate the scarcity
of resources in that country.
Table 10.1 Indicators of Cu, Fe, Al, and Pb
Resource name
Year
Domestic
exploration
Import Scraps Recycling
Substitution rate
(%)
Copper (10,000
tons)
2020 97.9
525.5 417.2 330.5
34.6
2030 70.9
608.8 778.8 607.8
47.2
2040 51.4
631.7 1050.1 808.7
54.2
Iron (million tons)
2020 223.9
438.8 257.1 223.5
25.2
2030 156.7
295.4 538.7 471.7
51.1
2040 0
248.3 808.8 711.6
74.1
Aluminum (10,000
tons)
2020 949.0
3441.1 2337.9 930.4
17.5
2030 803.3
5374.9 6269.9 2472.6
28.6
2040 680.0
6603.5 9388.4 3697.9
33.7
Lead (10,000 tons) 2020 0
678.4 101.85 549.3
44.7
2030 0
1029.5 1860.9 1012.9
49.6
2040 0
1130.6 2219.3 1208.2
51.7
Note: Substitution rate = recycling/(domestic exploration + import + recycling)
Source: Modified from Wen et al. (2015)
10 E-waste Management and the Conservation of Geochemical Scarce Resources
rates will increase by 19.6% and 48.8%, respectively. In addition, copper, aluminum, and lead import and export figures are also expected to rise.
Rare earth elements are also widely used in the electronic industry. These metals
have exclusive properties and are used as doping agents in semiconductors, printed
circuit boards (PCB), catalyzers, and photovoltaic cells, among other applications
(Ayres and Peiró 2013; Loureiro 2013).
In 2010 the European Commission looked into the availability of 41 raw materials and discovered that the supply of rare earth elements was at the highest risk of
shortage. In 2014 the list was reviewed and the same conclusion was reached. This
is due to the abundance of rare earth elements on the Earth’s crust, compared with
other metals, in addition to other challenges associated with the extraction of rare
earth elements in the environment as well as processing and global availability, like:
– Geological distribution: the ores containing rare earth elements rarely occur as
concentrated forms or in individually, which makes exploration more difficult.
– Mining risks: the elements usually occur next to uranium (U) or thorium (Th)
decay chains, which makes extraction even more complex due to the radiotoxicity hazard.
– Environmental process and impact: mining, leaching, pre-concentration, and the
various stages required to reach purity degrees needed in certain applications,
which may be as high as 99.99%, normally generate large amounts of waste and
effluents (European Commission 2010, 2014; Tunsu et al. 2015).
China produces 97% of the 125,000 tons of rare earth elements in the world, and
there is a strong demand for new ore deposits to extract these elements (Loureiro
2013). Nevertheless, urban mining is a potential alternative to mitigate the scarcity
of resources in that country.
Table 10.1 Indicators of Cu, Fe, Al, and Pb
Resource name
Year
Domestic
exploration
Import Scraps Recycling
Substitution rate
(%)
Copper (10,000
tons)
2020 97.9
525.5 417.2 330.5
34.6
2030 70.9
608.8 778.8 607.8
47.2
2040 51.4
631.7 1050.1 808.7
54.2
Iron (million tons)
2020 223.9
438.8 257.1 223.5
25.2
2030 156.7
295.4 538.7 471.7
51.1
2040 0
248.3 808.8 711.6
74.1
Aluminum (10,000
tons)
2020 949.0
3441.1 2337.9 930.4
17.5
2030 803.3
5374.9 6269.9 2472.6
28.6
2040 680.0
6603.5 9388.4 3697.9
33.7
Lead (10,000 tons) 2020 0
678.4 101.85 549.3
44.7
2030 0
1029.5 1860.9 1012.9
49.6
2040 0
1130.6 2219.3 1208.2
51.7
Note: Substitution rate = recycling/(domestic exploration + import + recycling)
Source: Modified from Wen et al. (2015)
10 E-waste Management and the Conservation of Geochemical Scarce Resources