

133
If θ = 1, then y k performs on the efficient frontier, while if θ > 1, then it is needed
an increase in the level of output output vector y k to find the efficiency frontier. To
quantify the output efficient score, θ, we could follow two ways: operate with frontier production functions (parametric approach) or operate without imposing any
functional form in particular (nonparametric DEA models). We apply here the nonparametric approach. The linear programming problem used to calculate the efficient frontier for the output-oriented efficiency coefficient known as Data
Envelopment Analysis (DEA) in variable returns to scale version (VRS) is the
following:
DF x y
z y
y
m
M
z x
o
o o
z
K
k
k km
m
o
K
k
k
k
,
subject to
( ) =
∑
≥
= …
∑
=
=
max
,
,
,
θ
θ
θ
1
1
1
k kn
n
o
K
k
k
k
x
n
N
z
z
k
K
≤
= …
∑ =
≥
= …
=
1
1
0
1
1
,
,
,
,
,
.
(7.5)
Note that the restriction from 7.5: ∑ =
=
K
k
k
z
1
1 corresponds to the DEA–VRS program, meaning the technology exhibits variable returns to scale.
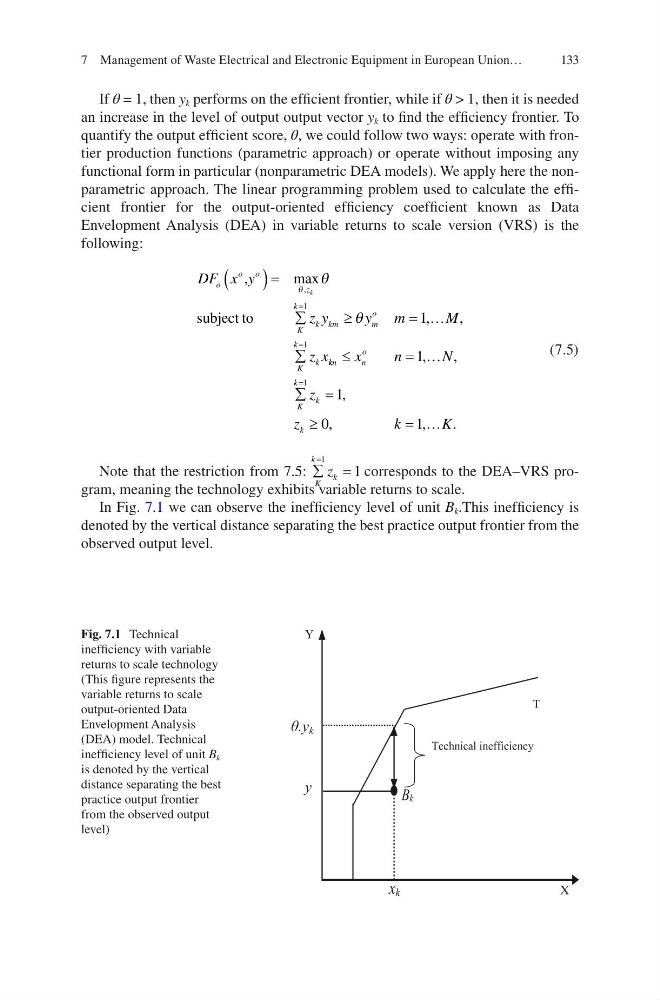
In Fig. 7.1 we can observe the inefficiency level of unit B k .This inefficiency is
denoted by the vertical distance separating the best practice output frontier from the
observed output level.
Y
θ.y k
y
Fig. 7.1 Technical
inefficiency with variable
returns to scale technology
(This figure represents the
variable returns to scale
output-oriented Data
Envelopment Analysis
(DEA) model. Technical
inefficiency level of unit B k
is denoted by the vertical
distance separating the best
practice output frontier
from the observed output
level)
7 Management of Waste Electrical and Electronic Equipment in European Union…
If θ = 1, then y k performs on the efficient frontier, while if θ > 1, then it is needed
an increase in the level of output output vector y k to find the efficiency frontier. To
quantify the output efficient score, θ, we could follow two ways: operate with frontier production functions (parametric approach) or operate without imposing any
functional form in particular (nonparametric DEA models). We apply here the nonparametric approach. The linear programming problem used to calculate the efficient frontier for the output-oriented efficiency coefficient known as Data
Envelopment Analysis (DEA) in variable returns to scale version (VRS) is the
following:
DF x y
z y
y
m
M
z x
o
o o
z
K
k
k km
m
o
K
k
k
k
,
subject to
( ) =
∑
≥
= …
∑
=
=
max
,
,
,
θ
θ
θ
1
1
1
k kn
n
o
K
k
k
k
x
n
N
z
z
k
K
≤
= …
∑ =
≥
= …
=
1
1
0
1
1
,
,
,
,
,
.
(7.5)
Note that the restriction from 7.5: ∑ =
=
K
k
k
z
1
1 corresponds to the DEA–VRS program, meaning the technology exhibits variable returns to scale.
In Fig. 7.1 we can observe the inefficiency level of unit B k .This inefficiency is
denoted by the vertical distance separating the best practice output frontier from the
observed output level.
Y
θ.y k
y
Fig. 7.1 Technical
inefficiency with variable
returns to scale technology
(This figure represents the
variable returns to scale
output-oriented Data
Envelopment Analysis
(DEA) model. Technical
inefficiency level of unit B k
is denoted by the vertical
distance separating the best
practice output frontier
from the observed output
level)
7 Management of Waste Electrical and Electronic Equipment in European Union…