

4 The Analysis of Event-Related Potentials
69
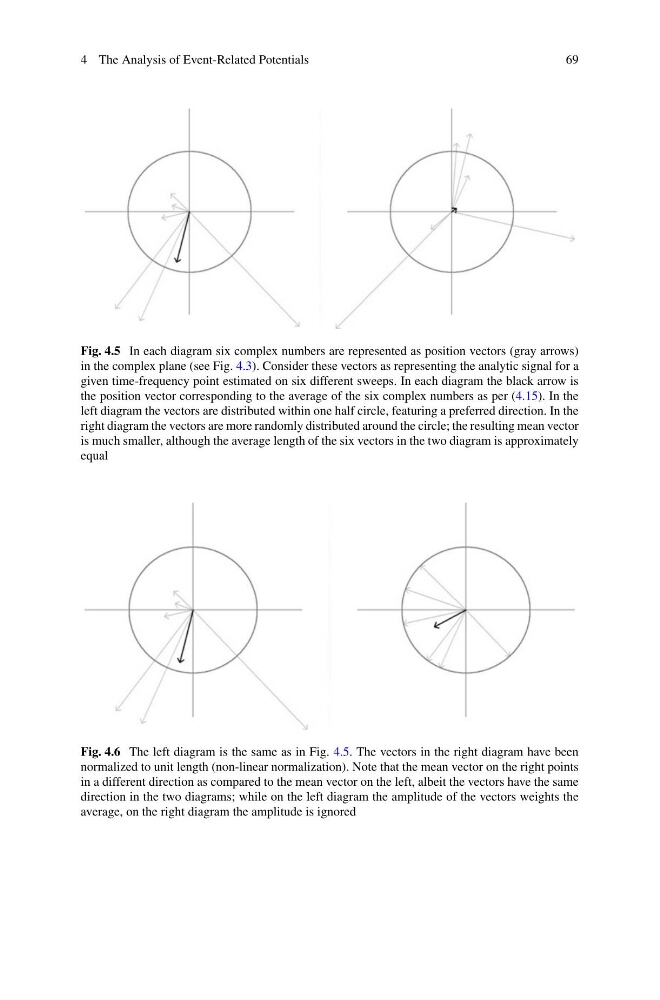
Fig. 4.5 In each diagram six complex numbers are represented as position vectors (gray arrows)
in the complex plane (see Fig. 4.3). Consider these vectors as representing the analytic signal for a
given time-frequency point estimated on six different sweeps. In each diagram the black arrow is
the position vector corresponding to the average of the six complex numbers as per (4.15). In the
left diagram the vectors are distributed within one half circle, featuring a preferred direction. In the
right diagram the vectors are more randomly distributed around the circle; the resulting mean vector
is much smaller, although the average length of the six vectors in the two diagram is approximately
equal
Fig. 4.6 The left diagram is the same as in Fig. 4.5. The vectors in the right diagram have been
normalized to unit length (non-linear normalization). Note that the mean vector on the right points
in a different direction as compared to the mean vector on the left, albeit the vectors have the same
direction in the two diagrams; while on the left diagram the amplitude of the vectors weights the
average, on the right diagram the amplitude is ignored
69
Fig. 4.5 In each diagram six complex numbers are represented as position vectors (gray arrows)
in the complex plane (see Fig. 4.3). Consider these vectors as representing the analytic signal for a
given time-frequency point estimated on six different sweeps. In each diagram the black arrow is
the position vector corresponding to the average of the six complex numbers as per (4.15). In the
left diagram the vectors are distributed within one half circle, featuring a preferred direction. In the
right diagram the vectors are more randomly distributed around the circle; the resulting mean vector
is much smaller, although the average length of the six vectors in the two diagram is approximately
equal
Fig. 4.6 The left diagram is the same as in Fig. 4.5. The vectors in the right diagram have been
normalized to unit length (non-linear normalization). Note that the mean vector on the right points
in a different direction as compared to the mean vector on the left, albeit the vectors have the same
direction in the two diagrams; while on the left diagram the amplitude of the vectors weights the
average, on the right diagram the amplitude is ignored