

3 EEG Spectral Analysis
41
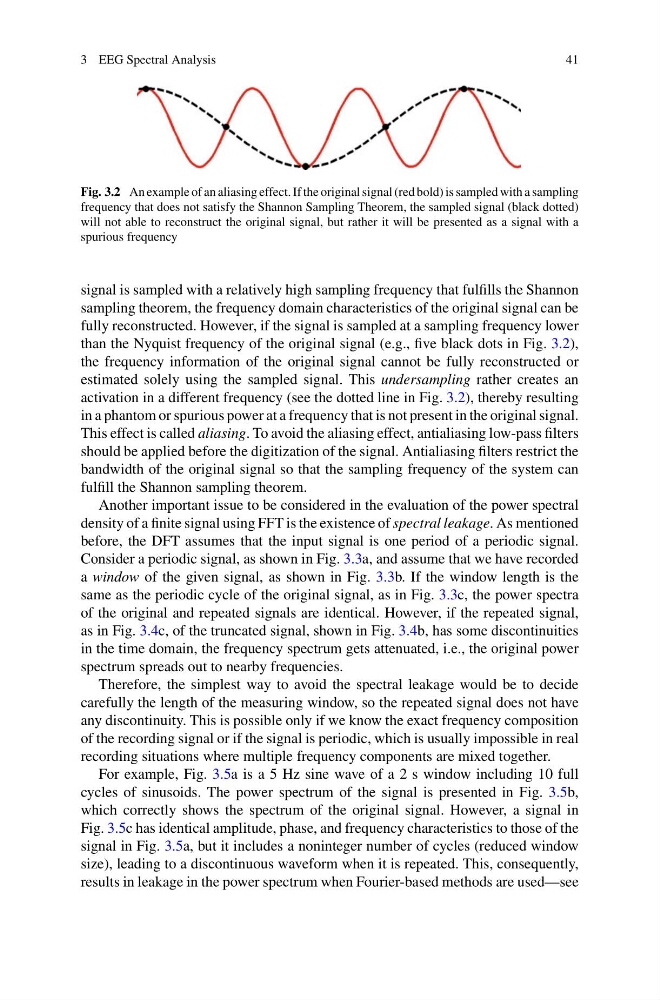
Fig. 3.2 An example of an aliasing effect. If the original signal (red bold) is sampled with a sampling
frequency that does not satisfy the Shannon Sampling Theorem, the sampled signal (black dotted)
will not able to reconstruct the original signal, but rather it will be presented as a signal with a
spurious frequency
signal is sampled with a relatively high sampling frequency that fulfills the Shannon
sampling theorem, the frequency domain characteristics of the original signal can be
fully reconstructed. However, if the signal is sampled at a sampling frequency lower
than the Nyquist frequency of the original signal (e.g., five black dots in Fig. 3.2),
the frequency information of the original signal cannot be fully reconstructed or
estimated solely using the sampled signal. This undersampling rather creates an
activation in a different frequency (see the dotted line in Fig. 3.2), thereby resulting
in a phantom or spurious power at a frequency that is not present in the original signal.
This effect is called aliasing. To avoid the aliasing effect, antialiasing low-pass filters
should be applied before the digitization of the signal. Antialiasing filters restrict the
bandwidth of the original signal so that the sampling frequency of the system can
fulfill the Shannon sampling theorem.
Another important issue to be considered in the evaluation of the power spectral
density of a finite signal using FFT is the existence of spectral leakage. As mentioned
before, the DFT assumes that the input signal is one period of a periodic signal.
Consider a periodic signal, as shown in Fig. 3.3a, and assume that we have recorded
a window of the given signal, as shown in Fig. 3.3b. If the window length is the
same as the periodic cycle of the original signal, as in Fig. 3.3c, the power spectra
of the original and repeated signals are identical. However, if the repeated signal,
as in Fig. 3.4c, of the truncated signal, shown in Fig. 3.4b, has some discontinuities
in the time domain, the frequency spectrum gets attenuated, i.e., the original power
spectrum spreads out to nearby frequencies.
Therefore, the simplest way to avoid the spectral leakage would be to decide
carefully the length of the measuring window, so the repeated signal does not have
any discontinuity. This is possible only if we know the exact frequency composition
of the recording signal or if the signal is periodic, which is usually impossible in real
recording situations where multiple frequency components are mixed together.
For example, Fig. 3.5a is a 5 Hz sine wave of a 2 s window including 10 full
cycles of sinusoids. The power spectrum of the signal is presented in Fig. 3.5b,
which correctly shows the spectrum of the original signal. However, a signal in
Fig. 3.5c has identical amplitude, phase, and frequency characteristics to those of the
signal in Fig. 3.5a, but it includes a noninteger number of cycles (reduced window
size), leading to a discontinuous waveform when it is repeated. This, consequently,
results in leakage in the power spectrum when Fourier-based methods are used—see
41
Fig. 3.2 An example of an aliasing effect. If the original signal (red bold) is sampled with a sampling
frequency that does not satisfy the Shannon Sampling Theorem, the sampled signal (black dotted)
will not able to reconstruct the original signal, but rather it will be presented as a signal with a
spurious frequency
signal is sampled with a relatively high sampling frequency that fulfills the Shannon
sampling theorem, the frequency domain characteristics of the original signal can be
fully reconstructed. However, if the signal is sampled at a sampling frequency lower
than the Nyquist frequency of the original signal (e.g., five black dots in Fig. 3.2),
the frequency information of the original signal cannot be fully reconstructed or
estimated solely using the sampled signal. This undersampling rather creates an
activation in a different frequency (see the dotted line in Fig. 3.2), thereby resulting
in a phantom or spurious power at a frequency that is not present in the original signal.
This effect is called aliasing. To avoid the aliasing effect, antialiasing low-pass filters
should be applied before the digitization of the signal. Antialiasing filters restrict the
bandwidth of the original signal so that the sampling frequency of the system can
fulfill the Shannon sampling theorem.
Another important issue to be considered in the evaluation of the power spectral
density of a finite signal using FFT is the existence of spectral leakage. As mentioned
before, the DFT assumes that the input signal is one period of a periodic signal.
Consider a periodic signal, as shown in Fig. 3.3a, and assume that we have recorded
a window of the given signal, as shown in Fig. 3.3b. If the window length is the
same as the periodic cycle of the original signal, as in Fig. 3.3c, the power spectra
of the original and repeated signals are identical. However, if the repeated signal,
as in Fig. 3.4c, of the truncated signal, shown in Fig. 3.4b, has some discontinuities
in the time domain, the frequency spectrum gets attenuated, i.e., the original power
spectrum spreads out to nearby frequencies.
Therefore, the simplest way to avoid the spectral leakage would be to decide
carefully the length of the measuring window, so the repeated signal does not have
any discontinuity. This is possible only if we know the exact frequency composition
of the recording signal or if the signal is periodic, which is usually impossible in real
recording situations where multiple frequency components are mixed together.
For example, Fig. 3.5a is a 5 Hz sine wave of a 2 s window including 10 full
cycles of sinusoids. The power spectrum of the signal is presented in Fig. 3.5b,
which correctly shows the spectrum of the original signal. However, a signal in
Fig. 3.5c has identical amplitude, phase, and frequency characteristics to those of the
signal in Fig. 3.5a, but it includes a noninteger number of cycles (reduced window
size), leading to a discontinuous waveform when it is repeated. This, consequently,
results in leakage in the power spectrum when Fourier-based methods are used—see