

222
D. Zhang
PLV(t)
N
i1 exp( jϕ i (t))
N
,
(10.6)
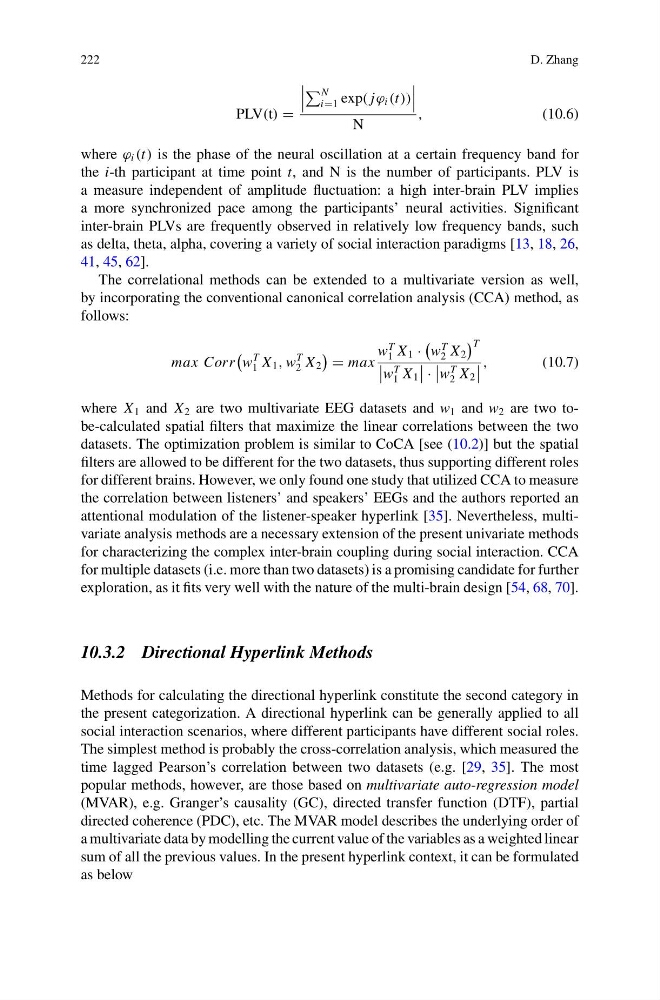
where ϕ i (t) is the phase of the neural oscillation at a certain frequency band for
the i-th participant at time point t, and N is the number of participants. PLV is
a measure independent of amplitude fluctuation: a high inter-brain PLV implies
a more synchronized pace among the participants’ neural activities. Significant
inter-brain PLVs are frequently observed in relatively low frequency bands, such
as delta, theta, alpha, covering a variety of social interaction paradigms [13, 18, 26,
41, 45, 62].
The correlational methods can be extended to a multivariate version as well,
by incorporating the conventional canonical correlation analysis (CCA) method, as
follows:
max Corr
w
T
1 X 1 , w
T
2 X 2
max
w
T
1 X 1 ·
w
T
2 X 2
T
w
T
1 X 1
·
w
T
2 X 2
,
(10.7)
where X 1 and X 2 are two multivariate EEG datasets and w 1 and w 2 are two tobe-calculated spatial filters that maximize the linear correlations between the two
datasets. The optimization problem is similar to CoCA [see (10.2)] but the spatial
filters are allowed to be different for the two datasets, thus supporting different roles
for different brains. However, we only found one study that utilized CCA to measure
the correlation between listeners’ and speakers’ EEGs and the authors reported an
attentional modulation of the listener-speaker hyperlink [35]. Nevertheless, multivariate analysis methods are a necessary extension of the present univariate methods
for characterizing the complex inter-brain coupling during social interaction. CCA
for multiple datasets (i.e. more than two datasets) is a promising candidate for further
exploration, as it fits very well with the nature of the multi-brain design [54, 68, 70].
10.3.2 Directional Hyperlink Methods
Methods for calculating the directional hyperlink constitute the second category in
the present categorization. A directional hyperlink can be generally applied to all
social interaction scenarios, where different participants have different social roles.
The simplest method is probably the cross-correlation analysis, which measured the
time lagged Pearson’s correlation between two datasets (e.g. [29, 35]. The most
popular methods, however, are those based on multivariate auto-regression model
(MVAR), e.g. Granger’s causality (GC), directed transfer function (DTF), partial
directed coherence (PDC), etc. The MVAR model describes the underlying order of
a multivariate data by modelling the current value of the variables as a weighted linear
sum of all the previous values. In the present hyperlink context, it can be formulated
as below
D. Zhang
PLV(t)
N
i1 exp( jϕ i (t))
N
,
(10.6)
where ϕ i (t) is the phase of the neural oscillation at a certain frequency band for
the i-th participant at time point t, and N is the number of participants. PLV is
a measure independent of amplitude fluctuation: a high inter-brain PLV implies
a more synchronized pace among the participants’ neural activities. Significant
inter-brain PLVs are frequently observed in relatively low frequency bands, such
as delta, theta, alpha, covering a variety of social interaction paradigms [13, 18, 26,
41, 45, 62].
The correlational methods can be extended to a multivariate version as well,
by incorporating the conventional canonical correlation analysis (CCA) method, as
follows:
max Corr
w
T
1 X 1 , w
T
2 X 2
max
w
T
1 X 1 ·
w
T
2 X 2
T
w
T
1 X 1
·
w
T
2 X 2
,
(10.7)
where X 1 and X 2 are two multivariate EEG datasets and w 1 and w 2 are two tobe-calculated spatial filters that maximize the linear correlations between the two
datasets. The optimization problem is similar to CoCA [see (10.2)] but the spatial
filters are allowed to be different for the two datasets, thus supporting different roles
for different brains. However, we only found one study that utilized CCA to measure
the correlation between listeners’ and speakers’ EEGs and the authors reported an
attentional modulation of the listener-speaker hyperlink [35]. Nevertheless, multivariate analysis methods are a necessary extension of the present univariate methods
for characterizing the complex inter-brain coupling during social interaction. CCA
for multiple datasets (i.e. more than two datasets) is a promising candidate for further
exploration, as it fits very well with the nature of the multi-brain design [54, 68, 70].
10.3.2 Directional Hyperlink Methods
Methods for calculating the directional hyperlink constitute the second category in
the present categorization. A directional hyperlink can be generally applied to all
social interaction scenarios, where different participants have different social roles.
The simplest method is probably the cross-correlation analysis, which measured the
time lagged Pearson’s correlation between two datasets (e.g. [29, 35]. The most
popular methods, however, are those based on multivariate auto-regression model
(MVAR), e.g. Granger’s causality (GC), directed transfer function (DTF), partial
directed coherence (PDC), etc. The MVAR model describes the underlying order of
a multivariate data by modelling the current value of the variables as a weighted linear
sum of all the previous values. In the present hyperlink context, it can be formulated
as below