

208
G. D. Johnson and D. J. Krusienski
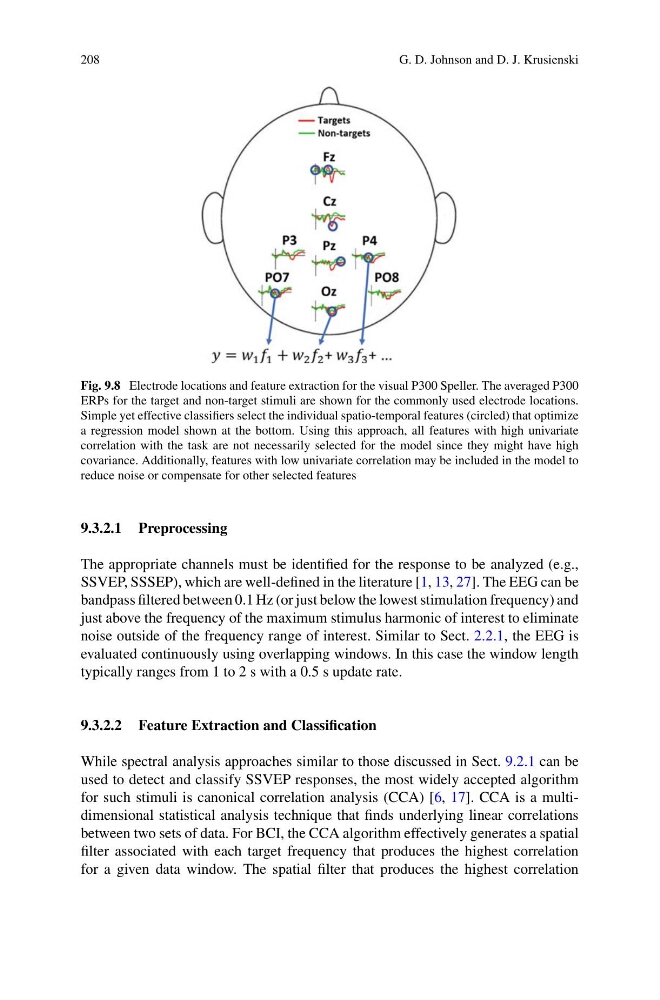
Fig. 9.8 Electrode locations and feature extraction for the visual P300 Speller. The averaged P300
ERPs for the target and non-target stimuli are shown for the commonly used electrode locations.
Simple yet effective classifiers select the individual spatio-temporal features (circled) that optimize
a regression model shown at the bottom. Using this approach, all features with high univariate
correlation with the task are not necessarily selected for the model since they might have high
covariance. Additionally, features with low univariate correlation may be included in the model to
reduce noise or compensate for other selected features
9.3.2.1 Preprocessing
The appropriate channels must be identified for the response to be analyzed (e.g.,
SSVEP, SSSEP), which are well-defined in the literature [1, 13, 27]. The EEG can be
bandpass filtered between 0.1 Hz (or just below the lowest stimulation frequency) and
just above the frequency of the maximum stimulus harmonic of interest to eliminate
noise outside of the frequency range of interest. Similar to Sect. 2.2.1, the EEG is
evaluated continuously using overlapping windows. In this case the window length
typically ranges from 1 to 2 s with a 0.5 s update rate.
9.3.2.2 Feature Extraction and Classification
While spectral analysis approaches similar to those discussed in Sect. 9.2.1 can be
used to detect and classify SSVEP responses, the most widely accepted algorithm
for such stimuli is canonical correlation analysis (CCA) [6, 17]. CCA is a multidimensional statistical analysis technique that finds underlying linear correlations
between two sets of data. For BCI, the CCA algorithm effectively generates a spatial
filter associated with each target frequency that produces the highest correlation
for a given data window. The spatial filter that produces the highest correlation
G. D. Johnson and D. J. Krusienski
Fig. 9.8 Electrode locations and feature extraction for the visual P300 Speller. The averaged P300
ERPs for the target and non-target stimuli are shown for the commonly used electrode locations.
Simple yet effective classifiers select the individual spatio-temporal features (circled) that optimize
a regression model shown at the bottom. Using this approach, all features with high univariate
correlation with the task are not necessarily selected for the model since they might have high
covariance. Additionally, features with low univariate correlation may be included in the model to
reduce noise or compensate for other selected features
9.3.2.1 Preprocessing
The appropriate channels must be identified for the response to be analyzed (e.g.,
SSVEP, SSSEP), which are well-defined in the literature [1, 13, 27]. The EEG can be
bandpass filtered between 0.1 Hz (or just below the lowest stimulation frequency) and
just above the frequency of the maximum stimulus harmonic of interest to eliminate
noise outside of the frequency range of interest. Similar to Sect. 2.2.1, the EEG is
evaluated continuously using overlapping windows. In this case the window length
typically ranges from 1 to 2 s with a 0.5 s update rate.
9.3.2.2 Feature Extraction and Classification
While spectral analysis approaches similar to those discussed in Sect. 9.2.1 can be
used to detect and classify SSVEP responses, the most widely accepted algorithm
for such stimuli is canonical correlation analysis (CCA) [6, 17]. CCA is a multidimensional statistical analysis technique that finds underlying linear correlations
between two sets of data. For BCI, the CCA algorithm effectively generates a spatial
filter associated with each target frequency that produces the highest correlation
for a given data window. The spatial filter that produces the highest correlation