

138
J. W. Choi and K. H. Kim
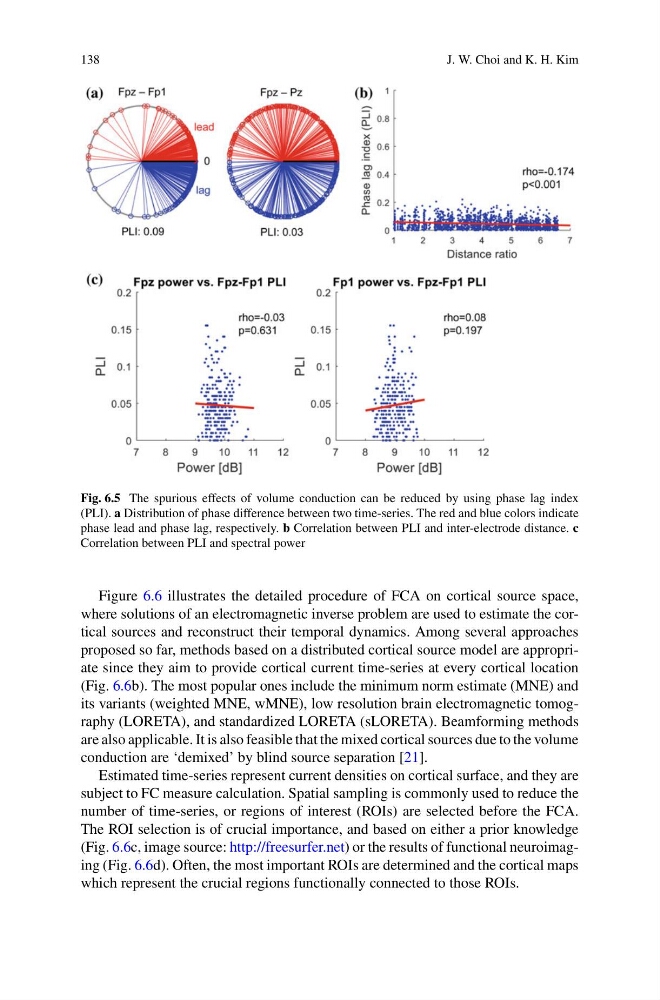
Fig. 6.5 The spurious effects of volume conduction can be reduced by using phase lag index
(PLI). a Distribution of phase difference between two time-series. The red and blue colors indicate
phase lead and phase lag, respectively. b Correlation between PLI and inter-electrode distance. c
Correlation between PLI and spectral power
Figure 6.6 illustrates the detailed procedure of FCA on cortical source space,
where solutions of an electromagnetic inverse problem are used to estimate the cortical sources and reconstruct their temporal dynamics. Among several approaches
proposed so far, methods based on a distributed cortical source model are appropriate since they aim to provide cortical current time-series at every cortical location
(Fig. 6.6b). The most popular ones include the minimum norm estimate (MNE) and
its variants (weighted MNE, wMNE), low resolution brain electromagnetic tomography (LORETA), and standardized LORETA (sLORETA). Beamforming methods
are also applicable. It is also feasible that the mixed cortical sources due to the volume
conduction are ‘demixed’ by blind source separation [21].
Estimated time-series represent current densities on cortical surface, and they are
subject to FC measure calculation. Spatial sampling is commonly used to reduce the
number of time-series, or regions of interest (ROIs) are selected before the FCA.
The ROI selection is of crucial importance, and based on either a prior knowledge
(Fig. 6.6c, image source: http://freesurfer.net) or the results of functional neuroimaging (Fig. 6.6d). Often, the most important ROIs are determined and the cortical maps
which represent the crucial regions functionally connected to those ROIs.
J. W. Choi and K. H. Kim
Fig. 6.5 The spurious effects of volume conduction can be reduced by using phase lag index
(PLI). a Distribution of phase difference between two time-series. The red and blue colors indicate
phase lead and phase lag, respectively. b Correlation between PLI and inter-electrode distance. c
Correlation between PLI and spectral power
Figure 6.6 illustrates the detailed procedure of FCA on cortical source space,
where solutions of an electromagnetic inverse problem are used to estimate the cortical sources and reconstruct their temporal dynamics. Among several approaches
proposed so far, methods based on a distributed cortical source model are appropriate since they aim to provide cortical current time-series at every cortical location
(Fig. 6.6b). The most popular ones include the minimum norm estimate (MNE) and
its variants (weighted MNE, wMNE), low resolution brain electromagnetic tomography (LORETA), and standardized LORETA (sLORETA). Beamforming methods
are also applicable. It is also feasible that the mixed cortical sources due to the volume
conduction are ‘demixed’ by blind source separation [21].
Estimated time-series represent current densities on cortical surface, and they are
subject to FC measure calculation. Spatial sampling is commonly used to reduce the
number of time-series, or regions of interest (ROIs) are selected before the FCA.
The ROI selection is of crucial importance, and based on either a prior knowledge
(Fig. 6.6c, image source: http://freesurfer.net) or the results of functional neuroimaging (Fig. 6.6d). Often, the most important ROIs are determined and the cortical maps
which represent the crucial regions functionally connected to those ROIs.