

134
J. W. Choi and K. H. Kim
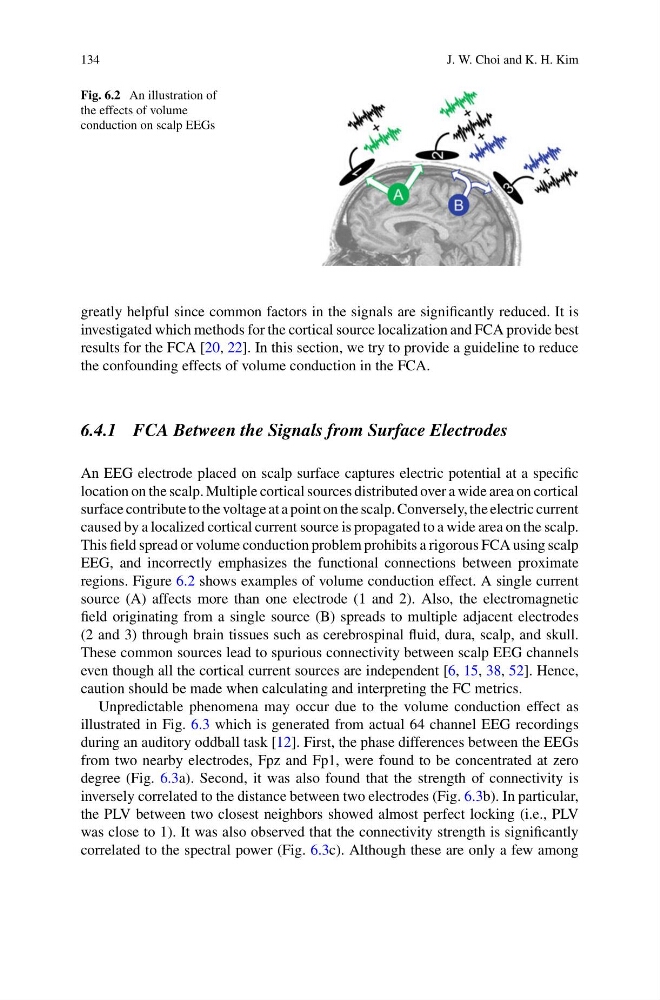
Fig. 6.2 An illustration of
the effects of volume
conduction on scalp EEGs
greatly helpful since common factors in the signals are significantly reduced. It is
investigated which methods for the cortical source localization and FCA provide best
results for the FCA [20, 22]. In this section, we try to provide a guideline to reduce
the confounding effects of volume conduction in the FCA.
6.4.1 FCA Between the Signals from Surface Electrodes
An EEG electrode placed on scalp surface captures electric potential at a specific
location on the scalp. Multiple cortical sources distributed over a wide area on cortical
surface contribute to the voltage at a point on the scalp. Conversely, the electric current
caused by a localized cortical current source is propagated to a wide area on the scalp.
This field spread or volume conduction problem prohibits a rigorous FCA using scalp
EEG, and incorrectly emphasizes the functional connections between proximate
regions. Figure 6.2 shows examples of volume conduction effect. A single current
source (A) affects more than one electrode (1 and 2). Also, the electromagnetic
field originating from a single source (B) spreads to multiple adjacent electrodes
(2 and 3) through brain tissues such as cerebrospinal fluid, dura, scalp, and skull.
These common sources lead to spurious connectivity between scalp EEG channels
even though all the cortical current sources are independent [6, 15, 38, 52]. Hence,
caution should be made when calculating and interpreting the FC metrics.
Unpredictable phenomena may occur due to the volume conduction effect as
illustrated in Fig. 6.3 which is generated from actual 64 channel EEG recordings
during an auditory oddball task [12]. First, the phase differences between the EEGs
from two nearby electrodes, Fpz and Fp1, were found to be concentrated at zero
degree (Fig. 6.3a). Second, it was also found that the strength of connectivity is
inversely correlated to the distance between two electrodes (Fig. 6.3b). In particular,
the PLV between two closest neighbors showed almost perfect locking (i.e., PLV
was close to 1). It was also observed that the connectivity strength is significantly
correlated to the spectral power (Fig. 6.3c). Although these are only a few among
J. W. Choi and K. H. Kim
Fig. 6.2 An illustration of
the effects of volume
conduction on scalp EEGs
greatly helpful since common factors in the signals are significantly reduced. It is
investigated which methods for the cortical source localization and FCA provide best
results for the FCA [20, 22]. In this section, we try to provide a guideline to reduce
the confounding effects of volume conduction in the FCA.
6.4.1 FCA Between the Signals from Surface Electrodes
An EEG electrode placed on scalp surface captures electric potential at a specific
location on the scalp. Multiple cortical sources distributed over a wide area on cortical
surface contribute to the voltage at a point on the scalp. Conversely, the electric current
caused by a localized cortical current source is propagated to a wide area on the scalp.
This field spread or volume conduction problem prohibits a rigorous FCA using scalp
EEG, and incorrectly emphasizes the functional connections between proximate
regions. Figure 6.2 shows examples of volume conduction effect. A single current
source (A) affects more than one electrode (1 and 2). Also, the electromagnetic
field originating from a single source (B) spreads to multiple adjacent electrodes
(2 and 3) through brain tissues such as cerebrospinal fluid, dura, scalp, and skull.
These common sources lead to spurious connectivity between scalp EEG channels
even though all the cortical current sources are independent [6, 15, 38, 52]. Hence,
caution should be made when calculating and interpreting the FC metrics.
Unpredictable phenomena may occur due to the volume conduction effect as
illustrated in Fig. 6.3 which is generated from actual 64 channel EEG recordings
during an auditory oddball task [12]. First, the phase differences between the EEGs
from two nearby electrodes, Fpz and Fp1, were found to be concentrated at zero
degree (Fig. 6.3a). Second, it was also found that the strength of connectivity is
inversely correlated to the distance between two electrodes (Fig. 6.3b). In particular,
the PLV between two closest neighbors showed almost perfect locking (i.e., PLV
was close to 1). It was also observed that the connectivity strength is significantly
correlated to the spectral power (Fig. 6.3c). Although these are only a few among