

6 Methods for Functional Connectivity Analysis
127
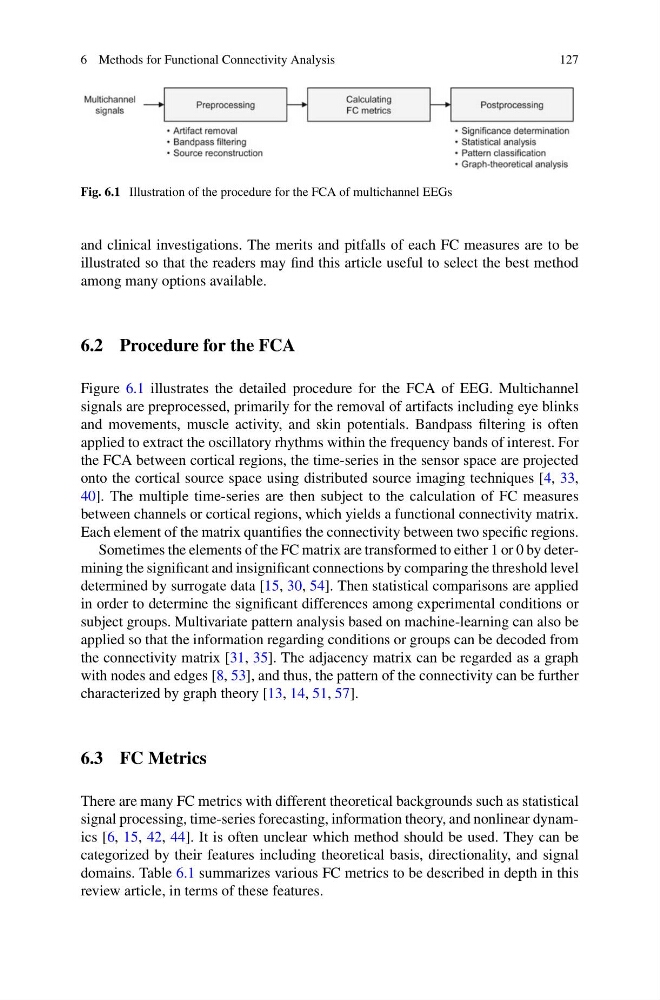
Fig. 6.1 Illustration of the procedure for the FCA of multichannel EEGs
and clinical investigations. The merits and pitfalls of each FC measures are to be
illustrated so that the readers may find this article useful to select the best method
among many options available.
6.2 Procedure for the FCA
Figure 6.1 illustrates the detailed procedure for the FCA of EEG. Multichannel
signals are preprocessed, primarily for the removal of artifacts including eye blinks
and movements, muscle activity, and skin potentials. Bandpass filtering is often
applied to extract the oscillatory rhythms within the frequency bands of interest. For
the FCA between cortical regions, the time-series in the sensor space are projected
onto the cortical source space using distributed source imaging techniques [4, 33,
40]. The multiple time-series are then subject to the calculation of FC measures
between channels or cortical regions, which yields a functional connectivity matrix.
Each element of the matrix quantifies the connectivity between two specific regions.
Sometimes the elements of the FC matrix are transformed to either 1 or 0 by determining the significant and insignificant connections by comparing the threshold level
determined by surrogate data [15, 30, 54]. Then statistical comparisons are applied
in order to determine the significant differences among experimental conditions or
subject groups. Multivariate pattern analysis based on machine-learning can also be
applied so that the information regarding conditions or groups can be decoded from
the connectivity matrix [31, 35]. The adjacency matrix can be regarded as a graph
with nodes and edges [8, 53], and thus, the pattern of the connectivity can be further
characterized by graph theory [13, 14, 51, 57].
6.3 FC Metrics
There are many FC metrics with different theoretical backgrounds such as statistical
signal processing, time-series forecasting, information theory, and nonlinear dynamics [6, 15, 42, 44]. It is often unclear which method should be used. They can be
categorized by their features including theoretical basis, directionality, and signal
domains. Table 6.1 summarizes various FC metrics to be described in depth in this
review article, in terms of these features.
127
Fig. 6.1 Illustration of the procedure for the FCA of multichannel EEGs
and clinical investigations. The merits and pitfalls of each FC measures are to be
illustrated so that the readers may find this article useful to select the best method
among many options available.
6.2 Procedure for the FCA
Figure 6.1 illustrates the detailed procedure for the FCA of EEG. Multichannel
signals are preprocessed, primarily for the removal of artifacts including eye blinks
and movements, muscle activity, and skin potentials. Bandpass filtering is often
applied to extract the oscillatory rhythms within the frequency bands of interest. For
the FCA between cortical regions, the time-series in the sensor space are projected
onto the cortical source space using distributed source imaging techniques [4, 33,
40]. The multiple time-series are then subject to the calculation of FC measures
between channels or cortical regions, which yields a functional connectivity matrix.
Each element of the matrix quantifies the connectivity between two specific regions.
Sometimes the elements of the FC matrix are transformed to either 1 or 0 by determining the significant and insignificant connections by comparing the threshold level
determined by surrogate data [15, 30, 54]. Then statistical comparisons are applied
in order to determine the significant differences among experimental conditions or
subject groups. Multivariate pattern analysis based on machine-learning can also be
applied so that the information regarding conditions or groups can be decoded from
the connectivity matrix [31, 35]. The adjacency matrix can be regarded as a graph
with nodes and edges [8, 53], and thus, the pattern of the connectivity can be further
characterized by graph theory [13, 14, 51, 57].
6.3 FC Metrics
There are many FC metrics with different theoretical backgrounds such as statistical
signal processing, time-series forecasting, information theory, and nonlinear dynamics [6, 15, 42, 44]. It is often unclear which method should be used. They can be
categorized by their features including theoretical basis, directionality, and signal
domains. Table 6.1 summarizes various FC metrics to be described in depth in this
review article, in terms of these features.