

(LDL) gold complex could enter into the hepatocytes after MPS depletion using
gadolinium chloride [50]. Recently, several in vivo imaging studies accompanied
by transmission electron microscopy (TEM) experiments revealed that the NPs
reached the hepatocytes and could be excreted via hepatobiliary excretion [40, 51,
52]. Several in vivo imaging studies including fluorescence [53, 54], magnetic
resonance imaging (MRI) [55–57], positron emission tomography (PET) [40]
showed the efficient hepatobiliary excretion of NPs after initial hepatic uptake of the
NPs (Fig. 19.9; Table 19.2). Also, several studies among them were able to show
that the NPs were taken up by hepatocytes and moved to bile canaliculi by TEM
imaging which proved the hepatobiliary excretion of the NPs [40, 52]. The process
of hepatobiliary excretion of NPs is schematically explained in Fig. 19.10 [64].
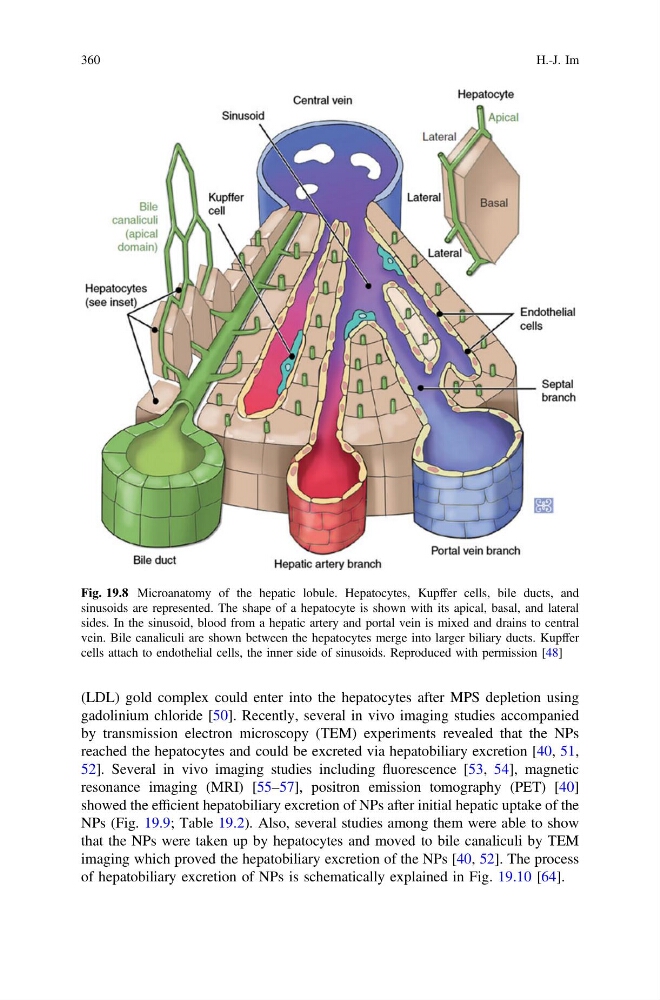
Fig. 19.8 Microanatomy of the hepatic lobule. Hepatocytes, Kupffer cells, bile ducts, and
sinusoids are represented. The shape of a hepatocyte is shown with its apical, basal, and lateral
sides. In the sinusoid, blood from a hepatic artery and portal vein is mixed and drains to central
vein. Bile canaliculi are shown between the hepatocytes merge into larger biliary ducts. Kupffer
cells attach to endothelial cells, the inner side of sinusoids. Reproduced with permission [48]
360
H.-J. Im
gadolinium chloride [50]. Recently, several in vivo imaging studies accompanied
by transmission electron microscopy (TEM) experiments revealed that the NPs
reached the hepatocytes and could be excreted via hepatobiliary excretion [40, 51,
52]. Several in vivo imaging studies including fluorescence [53, 54], magnetic
resonance imaging (MRI) [55–57], positron emission tomography (PET) [40]
showed the efficient hepatobiliary excretion of NPs after initial hepatic uptake of the
NPs (Fig. 19.9; Table 19.2). Also, several studies among them were able to show
that the NPs were taken up by hepatocytes and moved to bile canaliculi by TEM
imaging which proved the hepatobiliary excretion of the NPs [40, 52]. The process
of hepatobiliary excretion of NPs is schematically explained in Fig. 19.10 [64].
Fig. 19.8 Microanatomy of the hepatic lobule. Hepatocytes, Kupffer cells, bile ducts, and
sinusoids are represented. The shape of a hepatocyte is shown with its apical, basal, and lateral
sides. In the sinusoid, blood from a hepatic artery and portal vein is mixed and drains to central
vein. Bile canaliculi are shown between the hepatocytes merge into larger biliary ducts. Kupffer
cells attach to endothelial cells, the inner side of sinusoids. Reproduced with permission [48]
360
H.-J. Im