

confirmed by many other studies on the in vivo fate of QDs [67, 70–73]. For
example, Choi et al. reported the ability to control circulation half-life, organ- and
even tissue-selective biodistribution, and elimination route of dihydrolipoic acid
(DHLA)/PEG modified QDs (i.e., QD@DHLA–PEG n , n = 2–22) by altering the
length of PEG chains [74]. Results showed that QD@DHLA–PEG 2 (HD = 5.1 nm)
accumulated primarily in the liver (Fig. 17.3a), while the majority of QD@DHLA–
PEG 3 (HD = 5.3 nm) ended up in the kidney and bladder (Fig. 17.3b). QDs with
DHLA–PEG 4 coating (HD = 5.6 nm) had accelerated body excretion via the liver
and kidneys (Fig. 17.3c). In addition, uptake of QDs in the pancreas was only
observed when QDs were coated with DHLA–PEG 8 (HD = 6.5 nm) and DHLA–
PEG 14 (HD = 8.7 nm) (Fig. 17.3d, e). QD@DHLA–PEG 22 (HD = 16 nm) exhibited poor clearance and were primarily detected in the vasculature at 4 h
post-injection, with delayed excretion through renal and hepatic routes (Fig. 17.3f).
Although distribution of QDs in different organs can be visualized based on whole
body or ex vivo fluorescence imaging [74], accurate quantification of individual
organ uptake over time might be challenging due to the prominent and variable
background autofluorescence and absorbance/scattering in blood and tissues.
In 2007, using serial non-invasive small animal PET imaging for a more accurate
assessment of the PK of QDs, Gambhir et al. reported for the first time the quantitative biodistribution of commercially available CdSe QDs (>10 nm) labeled with
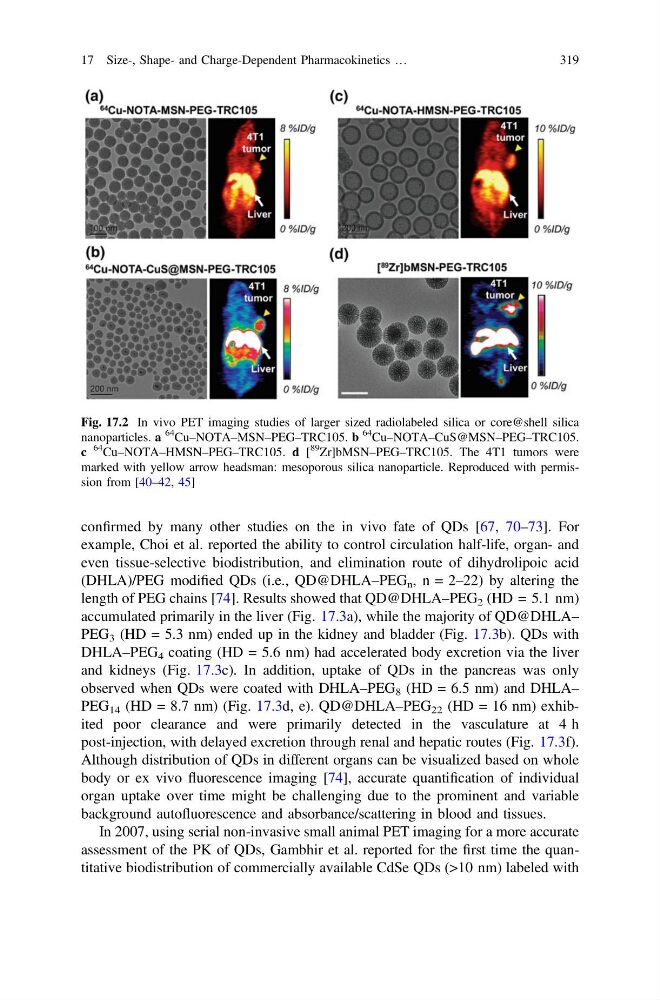
Fig. 17.2 In vivo PET imaging studies of larger sized radiolabeled silica or core@shell silica
nanoparticles. a
64
Cu–NOTA–MSN–PEG–TRC105. b
64
Cu–NOTA–CuS@MSN–PEG–TRC105.
c
64
Cu–NOTA–HMSN–PEG–TRC105. d [
89
Zr]bMSN–PEG–TRC105. The 4T1 tumors were
marked with yellow arrow headsman: mesoporous silica nanoparticle. Reproduced with permission from [40–42, 45]
17 Size-, Shape- and Charge-Dependent Pharmacokinetics …
319
example, Choi et al. reported the ability to control circulation half-life, organ- and
even tissue-selective biodistribution, and elimination route of dihydrolipoic acid
(DHLA)/PEG modified QDs (i.e., QD@DHLA–PEG n , n = 2–22) by altering the
length of PEG chains [74]. Results showed that QD@DHLA–PEG 2 (HD = 5.1 nm)
accumulated primarily in the liver (Fig. 17.3a), while the majority of QD@DHLA–
PEG 3 (HD = 5.3 nm) ended up in the kidney and bladder (Fig. 17.3b). QDs with
DHLA–PEG 4 coating (HD = 5.6 nm) had accelerated body excretion via the liver
and kidneys (Fig. 17.3c). In addition, uptake of QDs in the pancreas was only
observed when QDs were coated with DHLA–PEG 8 (HD = 6.5 nm) and DHLA–
PEG 14 (HD = 8.7 nm) (Fig. 17.3d, e). QD@DHLA–PEG 22 (HD = 16 nm) exhibited poor clearance and were primarily detected in the vasculature at 4 h
post-injection, with delayed excretion through renal and hepatic routes (Fig. 17.3f).
Although distribution of QDs in different organs can be visualized based on whole
body or ex vivo fluorescence imaging [74], accurate quantification of individual
organ uptake over time might be challenging due to the prominent and variable
background autofluorescence and absorbance/scattering in blood and tissues.
In 2007, using serial non-invasive small animal PET imaging for a more accurate
assessment of the PK of QDs, Gambhir et al. reported for the first time the quantitative biodistribution of commercially available CdSe QDs (>10 nm) labeled with
Fig. 17.2 In vivo PET imaging studies of larger sized radiolabeled silica or core@shell silica
nanoparticles. a
64
Cu–NOTA–MSN–PEG–TRC105. b
64
Cu–NOTA–CuS@MSN–PEG–TRC105.
c
64
Cu–NOTA–HMSN–PEG–TRC105. d [
89
Zr]bMSN–PEG–TRC105. The 4T1 tumors were
marked with yellow arrow headsman: mesoporous silica nanoparticle. Reproduced with permission from [40–42, 45]
17 Size-, Shape- and Charge-Dependent Pharmacokinetics …
319