

Atlas (Environment and Climate Change Canada, Government of Canada 2003)
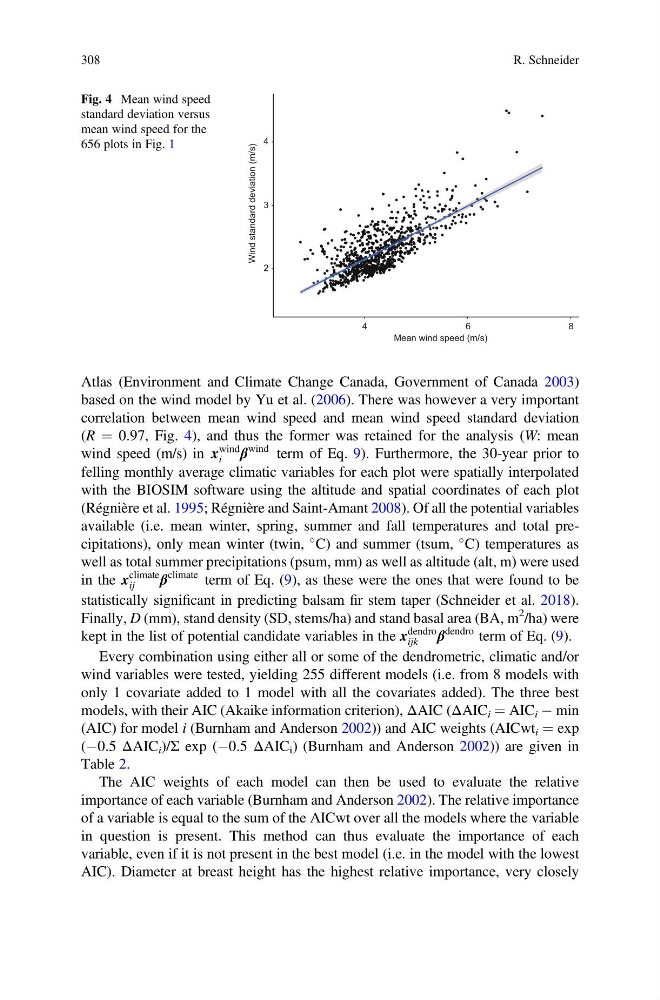
based on the wind model by Yu et al. (2006). There was however a very important
correlation between mean wind speed and mean wind speed standard deviation
(R ¼ 0.97, Fig. 4), and thus the former was retained for the analysis (W: mean
wind speed (m/s) in x
wind
i
β
wind term of Eq. 9). Furthermore, the 30-year prior to
felling monthly average climatic variables for each plot were spatially interpolated
with the BIOSIM software using the altitude and spatial coordinates of each plot
(Régnière et al. 1995; Régnière and Saint-Amant 2008). Of all the potential variables
available (i.e. mean winter, spring, summer and fall temperatures and total precipitations), only mean winter (twin,
C) and summer (tsum,
C) temperatures as
well as total summer precipitations (psum, mm) as well as altitude (alt, m) were used
in the x
climate
ij
β
climate term of Eq. (9), as these were the ones that were found to be
statistically significant in predicting balsam fir stem taper (Schneider et al. 2018).
Finally, D (mm), stand density (SD, stems/ha) and stand basal area (BA, m
2 /ha) were
kept in the list of potential candidate variables in the x
dendro
ijk
β
dendro term of Eq. (9).
Every combination using either all or some of the dendrometric, climatic and/or
wind variables were tested, yielding 255 different models (i.e. from 8 models with
only 1 covariate added to 1 model with all the covariates added). The three best
models, with their AIC (Akaike information criterion), ΔAIC (ΔAIC i ¼ AIC i À min
(AIC) for model i (Burnham and Anderson 2002)) and AIC weights (AICwt i ¼ exp
(À0.5 ΔAIC i )/Σ exp (À0.5 ΔAIC i ) (Burnham and Anderson 2002)) are given in
Table 2.
The AIC weights of each model can then be used to evaluate the relative
importance of each variable (Burnham and Anderson 2002). The relative importance
of a variable is equal to the sum of the AICwt over all the models where the variable
in question is present. This method can thus evaluate the importance of each
variable, even if it is not present in the best model (i.e. in the model with the lowest
AIC). Diameter at breast height has the highest relative importance, very closely
2
3
4
4
6
8
Mean wind speed (m/s)
Wind standard deviation (m/s)
Fig. 4 Mean wind speed
standard deviation versus
mean wind speed for the
656 plots in Fig. 1
308
R. Schneider
based on the wind model by Yu et al. (2006). There was however a very important
correlation between mean wind speed and mean wind speed standard deviation
(R ¼ 0.97, Fig. 4), and thus the former was retained for the analysis (W: mean
wind speed (m/s) in x
wind
i
β
wind term of Eq. 9). Furthermore, the 30-year prior to
felling monthly average climatic variables for each plot were spatially interpolated
with the BIOSIM software using the altitude and spatial coordinates of each plot
(Régnière et al. 1995; Régnière and Saint-Amant 2008). Of all the potential variables
available (i.e. mean winter, spring, summer and fall temperatures and total precipitations), only mean winter (twin,
C) and summer (tsum,
C) temperatures as
well as total summer precipitations (psum, mm) as well as altitude (alt, m) were used
in the x
climate
ij
β
climate term of Eq. (9), as these were the ones that were found to be
statistically significant in predicting balsam fir stem taper (Schneider et al. 2018).
Finally, D (mm), stand density (SD, stems/ha) and stand basal area (BA, m
2 /ha) were
kept in the list of potential candidate variables in the x
dendro
ijk
β
dendro term of Eq. (9).
Every combination using either all or some of the dendrometric, climatic and/or
wind variables were tested, yielding 255 different models (i.e. from 8 models with
only 1 covariate added to 1 model with all the covariates added). The three best
models, with their AIC (Akaike information criterion), ΔAIC (ΔAIC i ¼ AIC i À min
(AIC) for model i (Burnham and Anderson 2002)) and AIC weights (AICwt i ¼ exp
(À0.5 ΔAIC i )/Σ exp (À0.5 ΔAIC i ) (Burnham and Anderson 2002)) are given in
Table 2.
The AIC weights of each model can then be used to evaluate the relative
importance of each variable (Burnham and Anderson 2002). The relative importance
of a variable is equal to the sum of the AICwt over all the models where the variable
in question is present. This method can thus evaluate the importance of each
variable, even if it is not present in the best model (i.e. in the model with the lowest
AIC). Diameter at breast height has the highest relative importance, very closely
2
3
4
4
6
8
Mean wind speed (m/s)
Wind standard deviation (m/s)
Fig. 4 Mean wind speed
standard deviation versus
mean wind speed for the
656 plots in Fig. 1
308
R. Schneider