

6.5.2.4 Investigation of the Natural Attenuation in the Small Area
Figures 6.14 and 6.15 summarize, in two dimensions, the physical and chemical
parameters as well as the COCs distribution in the groundwater of the small area.
The area was selected such as to provide adequate coverage of the contamination
for further demonstration of the pilot efficiency. Results showed that the entire
investigated area was contaminated by COCs at all depth range. The highest
concentrations of total COCs in groundwater were detected in the upper zone of
the future pilot (South-West). PCE and TCE were confirmed to be the main
pollutants of concern on this site. Their contents, ranging from 5 to 870 μg L
À1
for PCE and from 140 to 13,000 μg L
À1 for TCE, decreased sharply in the direction
of the groundwater flow, due supposedly to natural attenuation. This process is
further supported by the presence of cis-1,2-DCE and VC, for which higher concentrations (up to 3700 μg L
À1 in PZ C23) were found at the North-West, in the
direction of the groundwater flow. In the area, pH was neutral in the range from 7.1
to 7.4, i.e., the optimal pH range for reductive biodechlorination (Aziz et al. 2013).
Redox potential ranged from À200 to À340 mV/Ag-AgCl, indicating mild
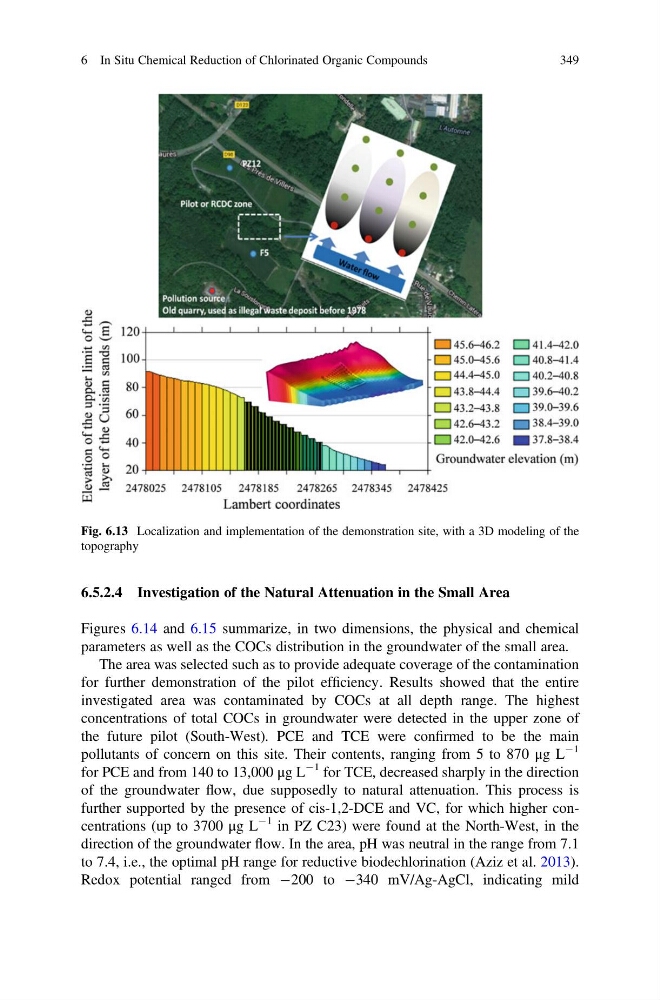
Fig. 6.13 Localization and implementation of the demonstration site, with a 3D modeling of the
topography
6 In Situ Chemical Reduction of Chlorinated Organic Compounds
349
Figures 6.14 and 6.15 summarize, in two dimensions, the physical and chemical
parameters as well as the COCs distribution in the groundwater of the small area.
The area was selected such as to provide adequate coverage of the contamination
for further demonstration of the pilot efficiency. Results showed that the entire
investigated area was contaminated by COCs at all depth range. The highest
concentrations of total COCs in groundwater were detected in the upper zone of
the future pilot (South-West). PCE and TCE were confirmed to be the main
pollutants of concern on this site. Their contents, ranging from 5 to 870 μg L
À1
for PCE and from 140 to 13,000 μg L
À1 for TCE, decreased sharply in the direction
of the groundwater flow, due supposedly to natural attenuation. This process is
further supported by the presence of cis-1,2-DCE and VC, for which higher concentrations (up to 3700 μg L
À1 in PZ C23) were found at the North-West, in the
direction of the groundwater flow. In the area, pH was neutral in the range from 7.1
to 7.4, i.e., the optimal pH range for reductive biodechlorination (Aziz et al. 2013).
Redox potential ranged from À200 to À340 mV/Ag-AgCl, indicating mild
Fig. 6.13 Localization and implementation of the demonstration site, with a 3D modeling of the
topography
6 In Situ Chemical Reduction of Chlorinated Organic Compounds
349