

mechanism and the limiting steps of the natural attenuation. Figures 6.9, 6.10, and
6.11, and 6.12 show the spatiotemporal evolution of the nature and abundance of
chlorinated ethenes in the groundwater. Other contaminants, not discussed here,
include chloroethanes and chloromethanes.
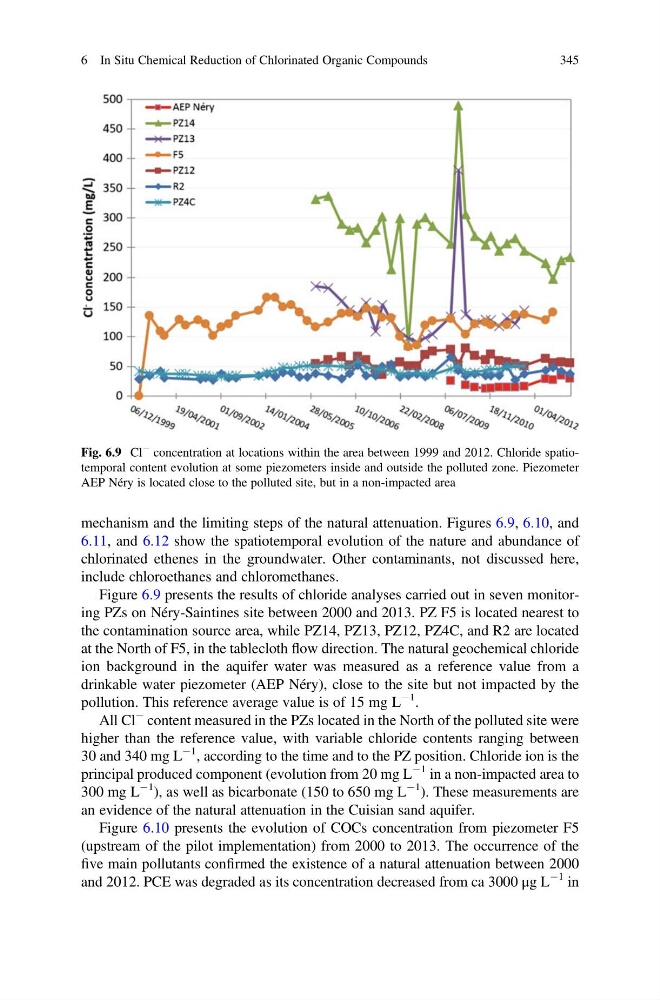
Figure 6.9 presents the results of chloride analyses carried out in seven monitoring PZs on Néry-Saintines site between 2000 and 2013. PZ F5 is located nearest to
the contamination source area, while PZ14, PZ13, PZ12, PZ4C, and R2 are located
at the North of F5, in the tablecloth flow direction. The natural geochemical chloride
ion background in the aquifer water was measured as a reference value from a
drinkable water piezometer (AEP Néry), close to the site but not impacted by the
pollution. This reference average value is of 15 mg L
À1 .
All Cl
À content measured in the PZs located in the North of the polluted site were
higher than the reference value, with variable chloride contents ranging between
30 and 340 mg L
À1 , according to the time and to the PZ position. Chloride ion is the
principal produced component (evolution from 20 mg L
À1 in a non-impacted area to
300 mg L
À1 ), as well as bicarbonate (150 to 650 mg L
À1 ). These measurements are
an evidence of the natural attenuation in the Cuisian sand aquifer.
Figure 6.10 presents the evolution of COCs concentration from piezometer F5
(upstream of the pilot implementation) from 2000 to 2013. The occurrence of the
five main pollutants confirmed the existence of a natural attenuation between 2000
and 2012. PCE was degraded as its concentration decreased from ca 3000 μg L
À1 in
Fig. 6.9 Cl
À concentration at locations within the area between 1999 and 2012. Chloride spatiotemporal content evolution at some piezometers inside and outside the polluted zone. Piezometer
AEP Néry is located close to the polluted site, but in a non-impacted area
6 In Situ Chemical Reduction of Chlorinated Organic Compounds
345
6.11, and 6.12 show the spatiotemporal evolution of the nature and abundance of
chlorinated ethenes in the groundwater. Other contaminants, not discussed here,
include chloroethanes and chloromethanes.
Figure 6.9 presents the results of chloride analyses carried out in seven monitoring PZs on Néry-Saintines site between 2000 and 2013. PZ F5 is located nearest to
the contamination source area, while PZ14, PZ13, PZ12, PZ4C, and R2 are located
at the North of F5, in the tablecloth flow direction. The natural geochemical chloride
ion background in the aquifer water was measured as a reference value from a
drinkable water piezometer (AEP Néry), close to the site but not impacted by the
pollution. This reference average value is of 15 mg L
À1 .
All Cl
À content measured in the PZs located in the North of the polluted site were
higher than the reference value, with variable chloride contents ranging between
30 and 340 mg L
À1 , according to the time and to the PZ position. Chloride ion is the
principal produced component (evolution from 20 mg L
À1 in a non-impacted area to
300 mg L
À1 ), as well as bicarbonate (150 to 650 mg L
À1 ). These measurements are
an evidence of the natural attenuation in the Cuisian sand aquifer.
Figure 6.10 presents the evolution of COCs concentration from piezometer F5
(upstream of the pilot implementation) from 2000 to 2013. The occurrence of the
five main pollutants confirmed the existence of a natural attenuation between 2000
and 2012. PCE was degraded as its concentration decreased from ca 3000 μg L
À1 in
Fig. 6.9 Cl
À concentration at locations within the area between 1999 and 2012. Chloride spatiotemporal content evolution at some piezometers inside and outside the polluted zone. Piezometer
AEP Néry is located close to the polluted site, but in a non-impacted area
6 In Situ Chemical Reduction of Chlorinated Organic Compounds
345