

columns prepared under conditions far from the field gave a good access to the
contaminant but were not representative of the field conditions.
The scale issue can also be analyzed from the point of view of the treatment agent
consumption. A simple ratio of the treatment agent mass added compared to the
contaminant removed mass for oxidation and surfactant, while the ratio is with air
consumption for sparging, was calculated in this study. For thermal treatment, the
approach is not meaningful. Indeed heating a saturated porous medium can easily be
calculated and is directly linked to the considered volume. The amount of energy
also depends on the natural groundwater flow rate, and is thus site dependent.
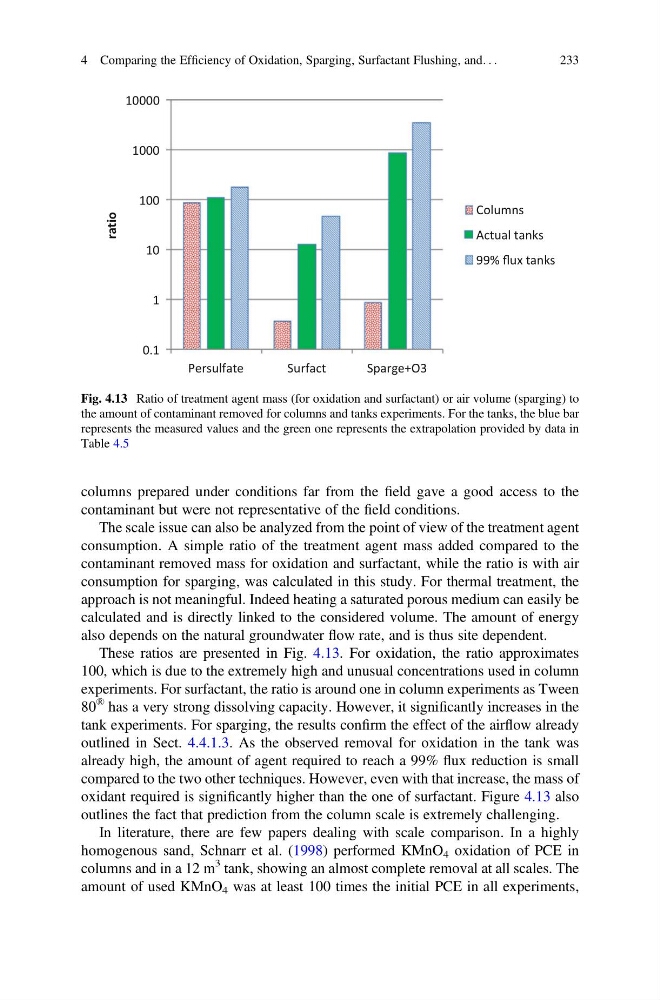
These ratios are presented in Fig. 4.13. For oxidation, the ratio approximates
100, which is due to the extremely high and unusual concentrations used in column
experiments. For surfactant, the ratio is around one in column experiments as Tween
80
® has a very strong dissolving capacity. However, it significantly increases in the
tank experiments. For sparging, the results confirm the effect of the airflow already
outlined in Sect. 4.4.1.3. As the observed removal for oxidation in the tank was
already high, the amount of agent required to reach a 99% flux reduction is small
compared to the two other techniques. However, even with that increase, the mass of
oxidant required is significantly higher than the one of surfactant. Figure 4.13 also
outlines the fact that prediction from the column scale is extremely challenging.
In literature, there are few papers dealing with scale comparison. In a highly
homogenous sand, Schnarr et al. (1998) performed KMnO 4 oxidation of PCE in
columns and in a 12 m
3 tank, showing an almost complete removal at all scales. The
amount of used KMnO 4 was at least 100 times the initial PCE in all experiments,
0.1
1
10
100
1000
10000
Persulfate
Surfact
Sparge+O3
rat io
Columns
Actual tanks
99% flux tanks
Fig. 4.13 Ratio of treatment agent mass (for oxidation and surfactant) or air volume (sparging) to
the amount of contaminant removed for columns and tanks experiments. For the tanks, the blue bar
represents the measured values and the green one represents the extrapolation provided by data in
Table 4.5
4 Comparing the Efficiency of Oxidation, Sparging, Surfactant Flushing, and. . .
233
contaminant but were not representative of the field conditions.
The scale issue can also be analyzed from the point of view of the treatment agent
consumption. A simple ratio of the treatment agent mass added compared to the
contaminant removed mass for oxidation and surfactant, while the ratio is with air
consumption for sparging, was calculated in this study. For thermal treatment, the
approach is not meaningful. Indeed heating a saturated porous medium can easily be
calculated and is directly linked to the considered volume. The amount of energy
also depends on the natural groundwater flow rate, and is thus site dependent.
These ratios are presented in Fig. 4.13. For oxidation, the ratio approximates
100, which is due to the extremely high and unusual concentrations used in column
experiments. For surfactant, the ratio is around one in column experiments as Tween
80
® has a very strong dissolving capacity. However, it significantly increases in the
tank experiments. For sparging, the results confirm the effect of the airflow already
outlined in Sect. 4.4.1.3. As the observed removal for oxidation in the tank was
already high, the amount of agent required to reach a 99% flux reduction is small
compared to the two other techniques. However, even with that increase, the mass of
oxidant required is significantly higher than the one of surfactant. Figure 4.13 also
outlines the fact that prediction from the column scale is extremely challenging.
In literature, there are few papers dealing with scale comparison. In a highly
homogenous sand, Schnarr et al. (1998) performed KMnO 4 oxidation of PCE in
columns and in a 12 m
3 tank, showing an almost complete removal at all scales. The
amount of used KMnO 4 was at least 100 times the initial PCE in all experiments,
0.1
1
10
100
1000
10000
Persulfate
Surfact
Sparge+O3
rat io
Columns
Actual tanks
99% flux tanks
Fig. 4.13 Ratio of treatment agent mass (for oxidation and surfactant) or air volume (sparging) to
the amount of contaminant removed for columns and tanks experiments. For the tanks, the blue bar
represents the measured values and the green one represents the extrapolation provided by data in
Table 4.5
4 Comparing the Efficiency of Oxidation, Sparging, Surfactant Flushing, and. . .
233