

initiated. Toluene concentrations outgoing from the tanks show important variations
(Jousse et al. 2017). This illustrates the high variability of the concentrations of an
emplaced NAPL source during the early cleaning phase (Rivett and Feenstra 2005).
Along the period, a similar temporal trend was observed, with some high concentration peaks correlated between the tanks. No links were observed between these
variations and temperature variations or some analytical biases. However, on average the concentrations are decreasing in all tanks after approximately 70 days of
flushing.
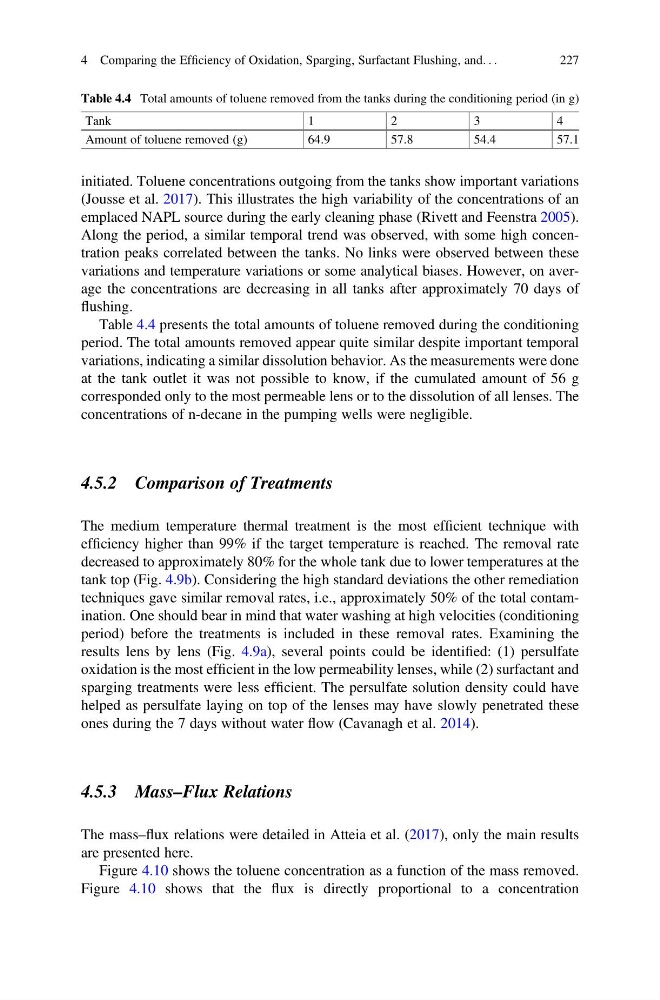
Table 4.4 presents the total amounts of toluene removed during the conditioning
period. The total amounts removed appear quite similar despite important temporal
variations, indicating a similar dissolution behavior. As the measurements were done
at the tank outlet it was not possible to know, if the cumulated amount of 56 g
corresponded only to the most permeable lens or to the dissolution of all lenses. The
concentrations of n-decane in the pumping wells were negligible.
4.5.2 Comparison of Treatments
The medium temperature thermal treatment is the most efficient technique with
efficiency higher than 99% if the target temperature is reached. The removal rate
decreased to approximately 80% for the whole tank due to lower temperatures at the
tank top (Fig. 4.9b). Considering the high standard deviations the other remediation
techniques gave similar removal rates, i.e., approximately 50% of the total contamination. One should bear in mind that water washing at high velocities (conditioning
period) before the treatments is included in these removal rates. Examining the
results lens by lens (Fig. 4.9a), several points could be identified: (1) persulfate
oxidation is the most efficient in the low permeability lenses, while (2) surfactant and
sparging treatments were less efficient. The persulfate solution density could have
helped as persulfate laying on top of the lenses may have slowly penetrated these
ones during the 7 days without water flow (Cavanagh et al. 2014).
4.5.3 Mass–Flux Relations
The mass–flux relations were detailed in Atteia et al. (2017), only the main results
are presented here.
Figure 4.10 shows the toluene concentration as a function of the mass removed.
Figure 4.10 shows that the flux is directly proportional to a concentration
Table 4.4 Total amounts of toluene removed from the tanks during the conditioning period (in g)
Tank
1
2
3
4
Amount of toluene removed (g)
64.9
57.8
54.4
57.1
4 Comparing the Efficiency of Oxidation, Sparging, Surfactant Flushing, and. . .
227
(Jousse et al. 2017). This illustrates the high variability of the concentrations of an
emplaced NAPL source during the early cleaning phase (Rivett and Feenstra 2005).
Along the period, a similar temporal trend was observed, with some high concentration peaks correlated between the tanks. No links were observed between these
variations and temperature variations or some analytical biases. However, on average the concentrations are decreasing in all tanks after approximately 70 days of
flushing.
Table 4.4 presents the total amounts of toluene removed during the conditioning
period. The total amounts removed appear quite similar despite important temporal
variations, indicating a similar dissolution behavior. As the measurements were done
at the tank outlet it was not possible to know, if the cumulated amount of 56 g
corresponded only to the most permeable lens or to the dissolution of all lenses. The
concentrations of n-decane in the pumping wells were negligible.
4.5.2 Comparison of Treatments
The medium temperature thermal treatment is the most efficient technique with
efficiency higher than 99% if the target temperature is reached. The removal rate
decreased to approximately 80% for the whole tank due to lower temperatures at the
tank top (Fig. 4.9b). Considering the high standard deviations the other remediation
techniques gave similar removal rates, i.e., approximately 50% of the total contamination. One should bear in mind that water washing at high velocities (conditioning
period) before the treatments is included in these removal rates. Examining the
results lens by lens (Fig. 4.9a), several points could be identified: (1) persulfate
oxidation is the most efficient in the low permeability lenses, while (2) surfactant and
sparging treatments were less efficient. The persulfate solution density could have
helped as persulfate laying on top of the lenses may have slowly penetrated these
ones during the 7 days without water flow (Cavanagh et al. 2014).
4.5.3 Mass–Flux Relations
The mass–flux relations were detailed in Atteia et al. (2017), only the main results
are presented here.
Figure 4.10 shows the toluene concentration as a function of the mass removed.
Figure 4.10 shows that the flux is directly proportional to a concentration
Table 4.4 Total amounts of toluene removed from the tanks during the conditioning period (in g)
Tank
1
2
3
4
Amount of toluene removed (g)
64.9
57.8
54.4
57.1
4 Comparing the Efficiency of Oxidation, Sparging, Surfactant Flushing, and. . .
227