

(10 μg L
À1 ). The modeling results for TPH concentrations for the drinking water
supply and river are shown in Fig. 2.39.
As displayed on Fig. 2.39 (at the end of the free product recovery operation
period), the residual concentrations at the pollution source are too high and may
significantly affect the drinking water supply and river water quality. It is therefore
necessary to reduce the concentrations of TPH at the source of pollution.
Iterative calculations using Visual MODFLOW calculated the maximum allowed
concentration immediately downstream of the contamination source that would have
no impact at the two monitoring stations considered ([TPH] residual ¼ 4000 μg L
À1 ).
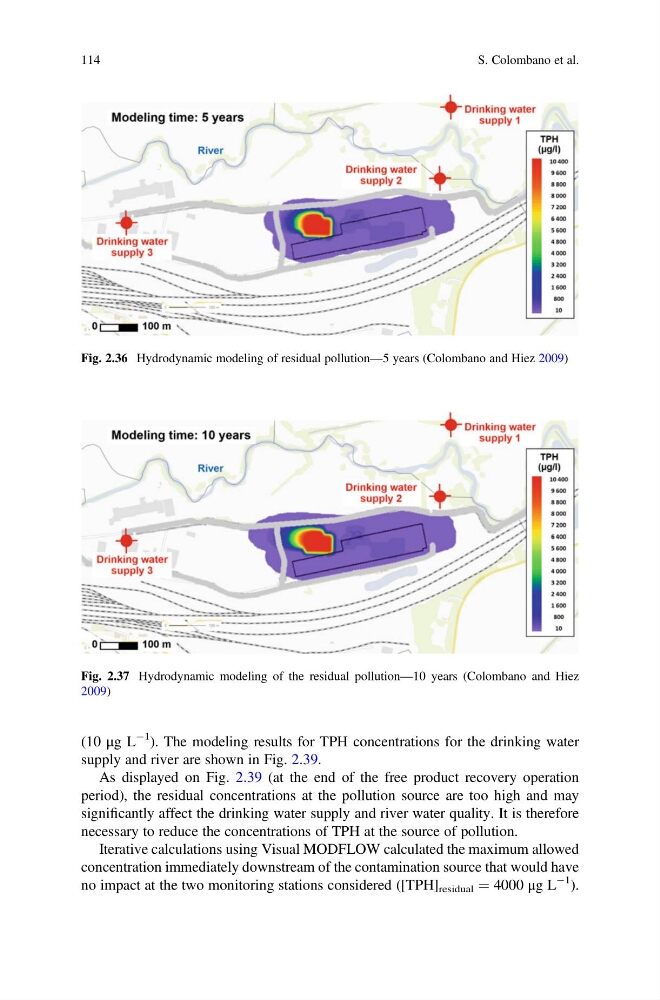
Fig. 2.36 Hydrodynamic modeling of residual pollution—5 years (Colombano and Hiez 2009)
Fig. 2.37 Hydrodynamic modeling of the residual pollution—10 years (Colombano and Hiez
2009)
114
S. Colombano et al.
À1 ). The modeling results for TPH concentrations for the drinking water
supply and river are shown in Fig. 2.39.
As displayed on Fig. 2.39 (at the end of the free product recovery operation
period), the residual concentrations at the pollution source are too high and may
significantly affect the drinking water supply and river water quality. It is therefore
necessary to reduce the concentrations of TPH at the source of pollution.
Iterative calculations using Visual MODFLOW calculated the maximum allowed
concentration immediately downstream of the contamination source that would have
no impact at the two monitoring stations considered ([TPH] residual ¼ 4000 μg L
À1 ).
Fig. 2.36 Hydrodynamic modeling of residual pollution—5 years (Colombano and Hiez 2009)
Fig. 2.37 Hydrodynamic modeling of the residual pollution—10 years (Colombano and Hiez
2009)
114
S. Colombano et al.