

• . total hydraulic ¼ 1.250–2.500 m
3 day
À1
• . max mass < 0.9 kg day
À1
• [HCt] max. < 0.5 mg L
À1
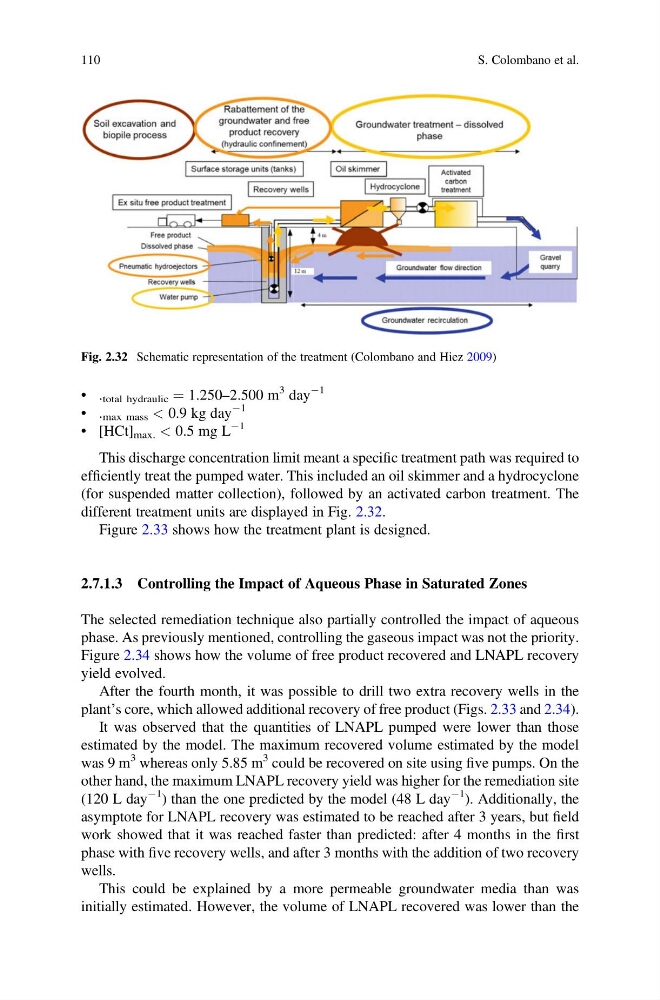
This discharge concentration limit meant a specific treatment path was required to
efficiently treat the pumped water. This included an oil skimmer and a hydrocyclone
(for suspended matter collection), followed by an activated carbon treatment. The
different treatment units are displayed in Fig. 2.32.
Figure 2.33 shows how the treatment plant is designed.
2.7.1.3 Controlling the Impact of Aqueous Phase in Saturated Zones
The selected remediation technique also partially controlled the impact of aqueous
phase. As previously mentioned, controlling the gaseous impact was not the priority.
Figure 2.34 shows how the volume of free product recovered and LNAPL recovery
yield evolved.
After the fourth month, it was possible to drill two extra recovery wells in the
plant’s core, which allowed additional recovery of free product (Figs. 2.33 and 2.34).
It was observed that the quantities of LNAPL pumped were lower than those
estimated by the model. The maximum recovered volume estimated by the model
was 9 m
3 whereas only 5.85 m
3 could be recovered on site using five pumps. On the
other hand, the maximum LNAPL recovery yield was higher for the remediation site
(120 L day
À1 ) than the one predicted by the model (48 L day
À1 ). Additionally, the
asymptote for LNAPL recovery was estimated to be reached after 3 years, but field
work showed that it was reached faster than predicted: after 4 months in the first
phase with five recovery wells, and after 3 months with the addition of two recovery
wells.
This could be explained by a more permeable groundwater media than was
initially estimated. However, the volume of LNAPL recovered was lower than the
Fig. 2.32 Schematic representation of the treatment (Colombano and Hiez 2009)
110
S. Colombano et al.
3 day
À1
• . max mass < 0.9 kg day
À1
• [HCt] max. < 0.5 mg L
À1
This discharge concentration limit meant a specific treatment path was required to
efficiently treat the pumped water. This included an oil skimmer and a hydrocyclone
(for suspended matter collection), followed by an activated carbon treatment. The
different treatment units are displayed in Fig. 2.32.
Figure 2.33 shows how the treatment plant is designed.
2.7.1.3 Controlling the Impact of Aqueous Phase in Saturated Zones
The selected remediation technique also partially controlled the impact of aqueous
phase. As previously mentioned, controlling the gaseous impact was not the priority.
Figure 2.34 shows how the volume of free product recovered and LNAPL recovery
yield evolved.
After the fourth month, it was possible to drill two extra recovery wells in the
plant’s core, which allowed additional recovery of free product (Figs. 2.33 and 2.34).
It was observed that the quantities of LNAPL pumped were lower than those
estimated by the model. The maximum recovered volume estimated by the model
was 9 m
3 whereas only 5.85 m
3 could be recovered on site using five pumps. On the
other hand, the maximum LNAPL recovery yield was higher for the remediation site
(120 L day
À1 ) than the one predicted by the model (48 L day
À1 ). Additionally, the
asymptote for LNAPL recovery was estimated to be reached after 3 years, but field
work showed that it was reached faster than predicted: after 4 months in the first
phase with five recovery wells, and after 3 months with the addition of two recovery
wells.
This could be explained by a more permeable groundwater media than was
initially estimated. However, the volume of LNAPL recovered was lower than the
Fig. 2.32 Schematic representation of the treatment (Colombano and Hiez 2009)
110
S. Colombano et al.