

trench. This would have created substantial perturbations in groundwater flow and a
potential rise in the water table upstream of the trench, at the plant.
Five water pumps were installed as a first approach. When remediation operations
were initiated, it was not possible to install recovery wells at the plant, although two
were installed later in the process.
The maximum flow rate for each pump was 20 m
3 h
À1 (i.e., 480 m
3 day
À1 ).
They were calculated to have a level variance in the polluted area of at least
10 cm compared to the table’s normal piezometric level. This implied finding a
suitable location for discharging the water pumped during the remediation
operations.
Several outflows were examined for the injection of treated groundwater. The
advantages and drawbacks of these outflows are described below.
0.5
0
0
1
1.5
2.5
3.5
4.5
5
4
3
2
Years
Pump/skimming
Trench
Volume of LNAPL recovered (m 3
)
2
4
6
8
10
12
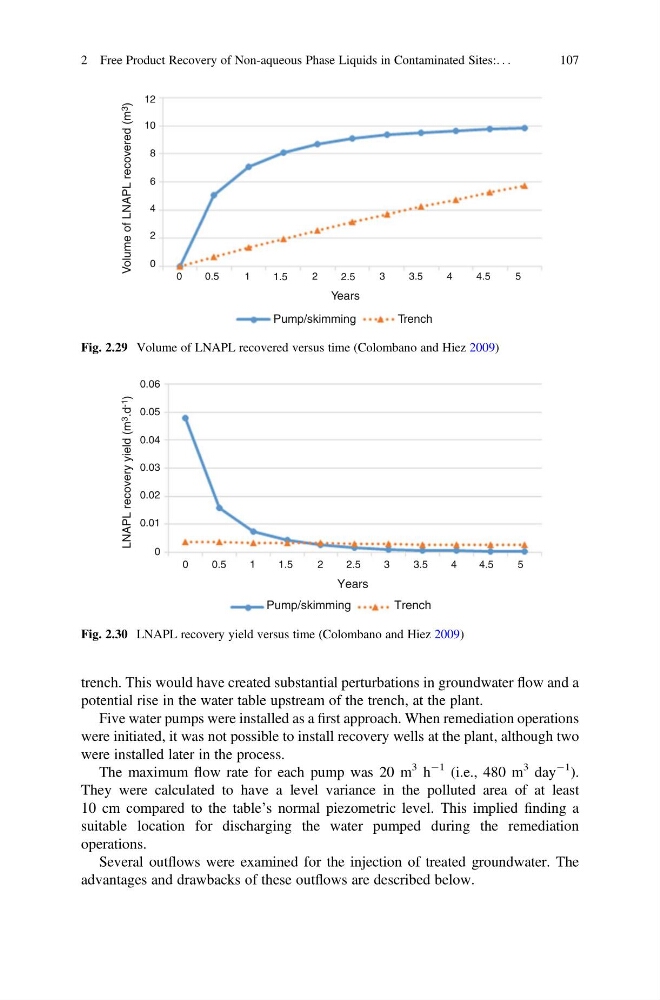
Fig. 2.29 Volume of LNAPL recovered versus time (Colombano and Hiez 2009)
0.06
0.05
0.04
0.03
0.02
0.01
0.5
0
0
1
1.5
2.5
3.5
4.5
5
4
3
2
Years
Pump/skimming
Trench
LNAPL recovery yield (m 3
.d -1
)
Fig. 2.30 LNAPL recovery yield versus time (Colombano and Hiez 2009)
2 Free Product Recovery of Non-aqueous Phase Liquids in Contaminated Sites:. . .
107
potential rise in the water table upstream of the trench, at the plant.
Five water pumps were installed as a first approach. When remediation operations
were initiated, it was not possible to install recovery wells at the plant, although two
were installed later in the process.
The maximum flow rate for each pump was 20 m
3 h
À1 (i.e., 480 m
3 day
À1 ).
They were calculated to have a level variance in the polluted area of at least
10 cm compared to the table’s normal piezometric level. This implied finding a
suitable location for discharging the water pumped during the remediation
operations.
Several outflows were examined for the injection of treated groundwater. The
advantages and drawbacks of these outflows are described below.
0.5
0
0
1
1.5
2.5
3.5
4.5
5
4
3
2
Years
Pump/skimming
Trench
Volume of LNAPL recovered (m 3
)
2
4
6
8
10
12
Fig. 2.29 Volume of LNAPL recovered versus time (Colombano and Hiez 2009)
0.06
0.05
0.04
0.03
0.02
0.01
0.5
0
0
1
1.5
2.5
3.5
4.5
5
4
3
2
Years
Pump/skimming
Trench
LNAPL recovery yield (m 3
.d -1
)
Fig. 2.30 LNAPL recovery yield versus time (Colombano and Hiez 2009)
2 Free Product Recovery of Non-aqueous Phase Liquids in Contaminated Sites:. . .
107