

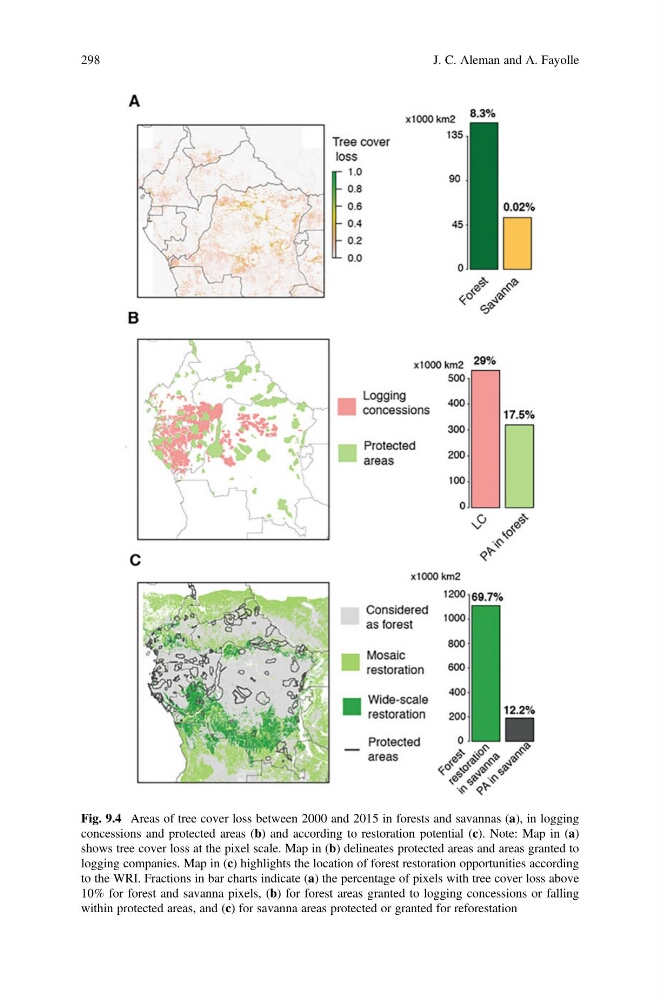
Fig. 9.4 Areas of tree cover loss between 2000 and 2015 in forests and savannas (a), in logging
concessions and protected areas (b) and according to restoration potential (c). Note: Map in (a)
shows tree cover loss at the pixel scale. Map in (b) delineates protected areas and areas granted to
logging companies. Map in (c) highlights the location of forest restoration opportunities according
to the WRI. Fractions in bar charts indicate (a) the percentage of pixels with tree cover loss above
10% for forest and savanna pixels, (b) for forest areas granted to logging concessions or falling
within protected areas, and (c) for savanna areas protected or granted for reforestation
298
J. C. Aleman and A. Fayolle
concessions and protected areas (b) and according to restoration potential (c). Note: Map in (a)
shows tree cover loss at the pixel scale. Map in (b) delineates protected areas and areas granted to
logging companies. Map in (c) highlights the location of forest restoration opportunities according
to the WRI. Fractions in bar charts indicate (a) the percentage of pixels with tree cover loss above
10% for forest and savanna pixels, (b) for forest areas granted to logging concessions or falling
within protected areas, and (c) for savanna areas protected or granted for reforestation
298
J. C. Aleman and A. Fayolle