

involved in construction in urban areas. On average loggers harvest 7.88 tons/month
of “Type A” timber. Type B timber comes in the form of chopped logs that are
1.1–1.2 m long, and is sold to bakers, fish smokers and barwomen. On average, the
interviewed loggers collected 367.5 tons/month of chopped-off Type B wood.
7.3.3 Household Energy Consumption
Household energy consumption was assessed through binary questions that captured
the type and source of biomass fuel. This included (a) fuelwood from mangrove
forest, fuelwood from upland forest and charcoal and (b) modern fuels including
kerosene, batteries and electricity.
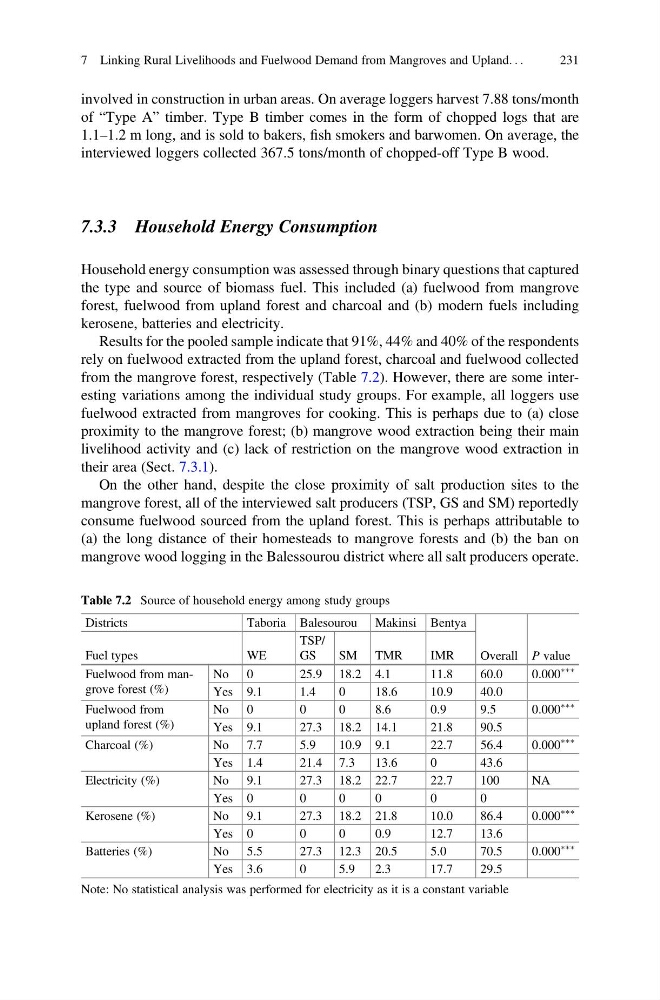
Results for the pooled sample indicate that 91%, 44% and 40% of the respondents
rely on fuelwood extracted from the upland forest, charcoal and fuelwood collected
from the mangrove forest, respectively (Table 7.2). However, there are some interesting variations among the individual study groups. For example, all loggers use
fuelwood extracted from mangroves for cooking. This is perhaps due to (a) close
proximity to the mangrove forest; (b) mangrove wood extraction being their main
livelihood activity and (c) lack of restriction on the mangrove wood extraction in
their area (Sect. 7.3.1).
On the other hand, despite the close proximity of salt production sites to the
mangrove forest, all of the interviewed salt producers (TSP, GS and SM) reportedly
consume fuelwood sourced from the upland forest. This is perhaps attributable to
(a) the long distance of their homesteads to mangrove forests and (b) the ban on
mangrove wood logging in the Balessourou district where all salt producers operate.
Table 7.2 Source of household energy among study groups
Districts
Taboria Balesourou Makinsi Bentya
Overall P value
Fuel types
WE
TSP/
GS
SM TMR
IMR
Fuelwood from mangrove forest (%)
No 0
25.9 18.2 4.1
11.8
60.0
0.000
ÃÃÃ
Yes 9.1
1.4
0
18.6
10.9
40.0
Fuelwood from
upland forest (%)
No 0
0
0
8.6
0.9
9.5
0.000
ÃÃÃ
Yes 9.1
27.3 18.2 14.1
21.8
90.5
Charcoal (%)
No 7.7
5.9
10.9 9.1
22.7
56.4
0.000
ÃÃÃ
Yes 1.4
21.4 7.3
13.6
0
43.6
Electricity (%)
No 9.1
27.3 18.2 22.7
22.7
100
NA
Yes 0
0
0
0
0
0
Kerosene (%)
No 9.1
27.3 18.2 21.8
10.0
86.4
0.000
ÃÃÃ
Yes 0
0
0
0.9
12.7
13.6
Batteries (%)
No 5.5
27.3 12.3 20.5
5.0
70.5
0.000
ÃÃÃ
Yes 3.6
0
5.9
2.3
17.7
29.5
Note: No statistical analysis was performed for electricity as it is a constant variable
7 Linking Rural Livelihoods and Fuelwood Demand from Mangroves and Upland. . .
231
of “Type A” timber. Type B timber comes in the form of chopped logs that are
1.1–1.2 m long, and is sold to bakers, fish smokers and barwomen. On average, the
interviewed loggers collected 367.5 tons/month of chopped-off Type B wood.
7.3.3 Household Energy Consumption
Household energy consumption was assessed through binary questions that captured
the type and source of biomass fuel. This included (a) fuelwood from mangrove
forest, fuelwood from upland forest and charcoal and (b) modern fuels including
kerosene, batteries and electricity.
Results for the pooled sample indicate that 91%, 44% and 40% of the respondents
rely on fuelwood extracted from the upland forest, charcoal and fuelwood collected
from the mangrove forest, respectively (Table 7.2). However, there are some interesting variations among the individual study groups. For example, all loggers use
fuelwood extracted from mangroves for cooking. This is perhaps due to (a) close
proximity to the mangrove forest; (b) mangrove wood extraction being their main
livelihood activity and (c) lack of restriction on the mangrove wood extraction in
their area (Sect. 7.3.1).
On the other hand, despite the close proximity of salt production sites to the
mangrove forest, all of the interviewed salt producers (TSP, GS and SM) reportedly
consume fuelwood sourced from the upland forest. This is perhaps attributable to
(a) the long distance of their homesteads to mangrove forests and (b) the ban on
mangrove wood logging in the Balessourou district where all salt producers operate.
Table 7.2 Source of household energy among study groups
Districts
Taboria Balesourou Makinsi Bentya
Overall P value
Fuel types
WE
TSP/
GS
SM TMR
IMR
Fuelwood from mangrove forest (%)
No 0
25.9 18.2 4.1
11.8
60.0
0.000
ÃÃÃ
Yes 9.1
1.4
0
18.6
10.9
40.0
Fuelwood from
upland forest (%)
No 0
0
0
8.6
0.9
9.5
0.000
ÃÃÃ
Yes 9.1
27.3 18.2 14.1
21.8
90.5
Charcoal (%)
No 7.7
5.9
10.9 9.1
22.7
56.4
0.000
ÃÃÃ
Yes 1.4
21.4 7.3
13.6
0
43.6
Electricity (%)
No 9.1
27.3 18.2 22.7
22.7
100
NA
Yes 0
0
0
0
0
0
Kerosene (%)
No 9.1
27.3 18.2 21.8
10.0
86.4
0.000
ÃÃÃ
Yes 0
0
0
0.9
12.7
13.6
Batteries (%)
No 5.5
27.3 12.3 20.5
5.0
70.5
0.000
ÃÃÃ
Yes 3.6
0
5.9
2.3
17.7
29.5
Note: No statistical analysis was performed for electricity as it is a constant variable
7 Linking Rural Livelihoods and Fuelwood Demand from Mangroves and Upland. . .
231