

(i.e. environmental management, land use and cover and agriculture productivity)
being still “very low”. This suggests that most of these resilience elements are of
major concern, including protected/conservation areas, understanding of local ecosystem functions, access to critical ecosystem services, rangeland availability, arable
land availability, secure food supply and nutrition and cultivation of flood- and
drought-tolerant crops.
With regards to the perceived engineering resilience, the overall mean score of
1.8 and 1.9 for drought- and flood-prone locations can be considered as quite low.
The mean scores for the three sub-dimensions of engineering resilience (i.e. DRR
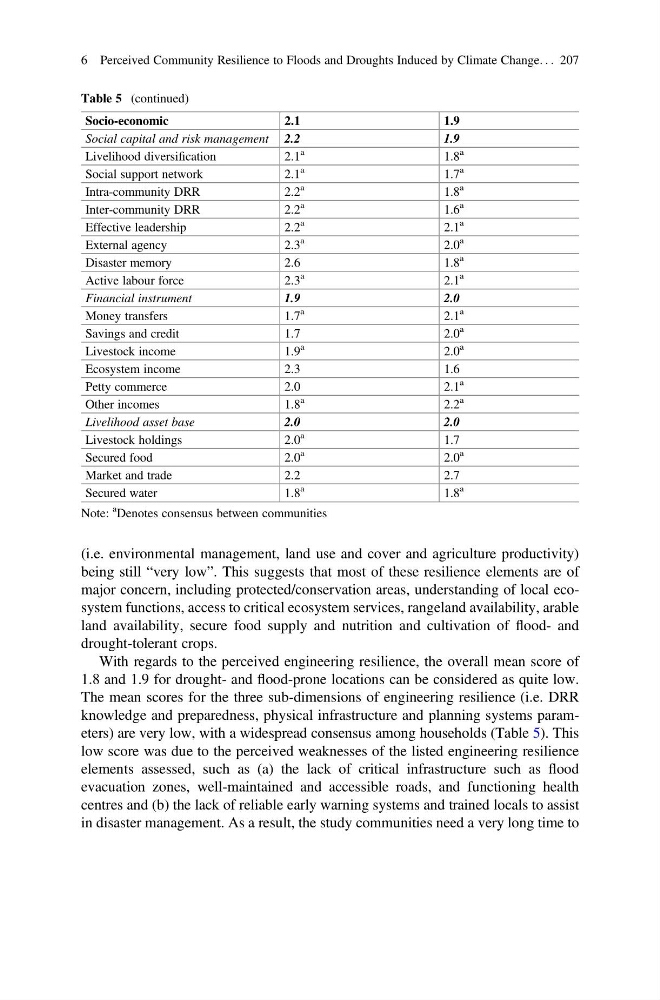
knowledge and preparedness, physical infrastructure and planning systems parameters) are very low, with a widespread consensus among households (Table 5). This
low score was due to the perceived weaknesses of the listed engineering resilience
elements assessed, such as (a) the lack of critical infrastructure such as flood
evacuation zones, well-maintained and accessible roads, and functioning health
centres and (b) the lack of reliable early warning systems and trained locals to assist
in disaster management. As a result, the study communities need a very long time to
Table 5 (continued)
Socio-economic
2.1
1.9
Social capital and risk management 2.2
1.9
Livelihood diversification
2.1
a
1.8
a
Social support network
2.1
a
1.7
a
Intra-community DRR
2.2
a
1.8
a
Inter-community DRR
2.2
a
1.6
a
Effective leadership
2.2
a
2.1
a
External agency
2.3
a
2.0
a
Disaster memory
2.6
1.8
a
Active labour force
2.3
a
2.1
a
Financial instrument
1.9
2.0
Money transfers
1.7
a
2.1
a
Savings and credit
1.7
2.0
a
Livestock income
1.9
a
2.0
a
Ecosystem income
2.3
1.6
Petty commerce
2.0
2.1
a
Other incomes
1.8
a
2.2
a
Livelihood asset base
2.0
2.0
Livestock holdings
2.0
a
1.7
Secured food
2.0
a
2.0
a
Market and trade
2.2
2.7
Secured water
1.8
a
1.8
a
Note:
a Denotes consensus between communities
6 Perceived Community Resilience to Floods and Droughts Induced by Climate Change. . . 207
being still “very low”. This suggests that most of these resilience elements are of
major concern, including protected/conservation areas, understanding of local ecosystem functions, access to critical ecosystem services, rangeland availability, arable
land availability, secure food supply and nutrition and cultivation of flood- and
drought-tolerant crops.
With regards to the perceived engineering resilience, the overall mean score of
1.8 and 1.9 for drought- and flood-prone locations can be considered as quite low.
The mean scores for the three sub-dimensions of engineering resilience (i.e. DRR
knowledge and preparedness, physical infrastructure and planning systems parameters) are very low, with a widespread consensus among households (Table 5). This
low score was due to the perceived weaknesses of the listed engineering resilience
elements assessed, such as (a) the lack of critical infrastructure such as flood
evacuation zones, well-maintained and accessible roads, and functioning health
centres and (b) the lack of reliable early warning systems and trained locals to assist
in disaster management. As a result, the study communities need a very long time to
Table 5 (continued)
Socio-economic
2.1
1.9
Social capital and risk management 2.2
1.9
Livelihood diversification
2.1
a
1.8
a
Social support network
2.1
a
1.7
a
Intra-community DRR
2.2
a
1.8
a
Inter-community DRR
2.2
a
1.6
a
Effective leadership
2.2
a
2.1
a
External agency
2.3
a
2.0
a
Disaster memory
2.6
1.8
a
Active labour force
2.3
a
2.1
a
Financial instrument
1.9
2.0
Money transfers
1.7
a
2.1
a
Savings and credit
1.7
2.0
a
Livestock income
1.9
a
2.0
a
Ecosystem income
2.3
1.6
Petty commerce
2.0
2.1
a
Other incomes
1.8
a
2.2
a
Livelihood asset base
2.0
2.0
Livestock holdings
2.0
a
1.7
Secured food
2.0
a
2.0
a
Market and trade
2.2
2.7
Secured water
1.8
a
1.8
a
Note:
a Denotes consensus between communities
6 Perceived Community Resilience to Floods and Droughts Induced by Climate Change. . . 207