

accounting for this is inability to recall since the impacts of the events are not
recorded.
FGD participants in drought-prone communities such as Yoggu, Fihini and
Daboshe constantly drew our attention to how scarce and unproductive arable land
has resulted in the adoption of intensive and uninterrupted farming practices. Most of
the discussants revealed that, maize is extensively cultivated largely due to the
availability of drought-resistant varieties, lower labour requirement and quick maturation compared to other staple crops such sorghum and yam. Although there is no
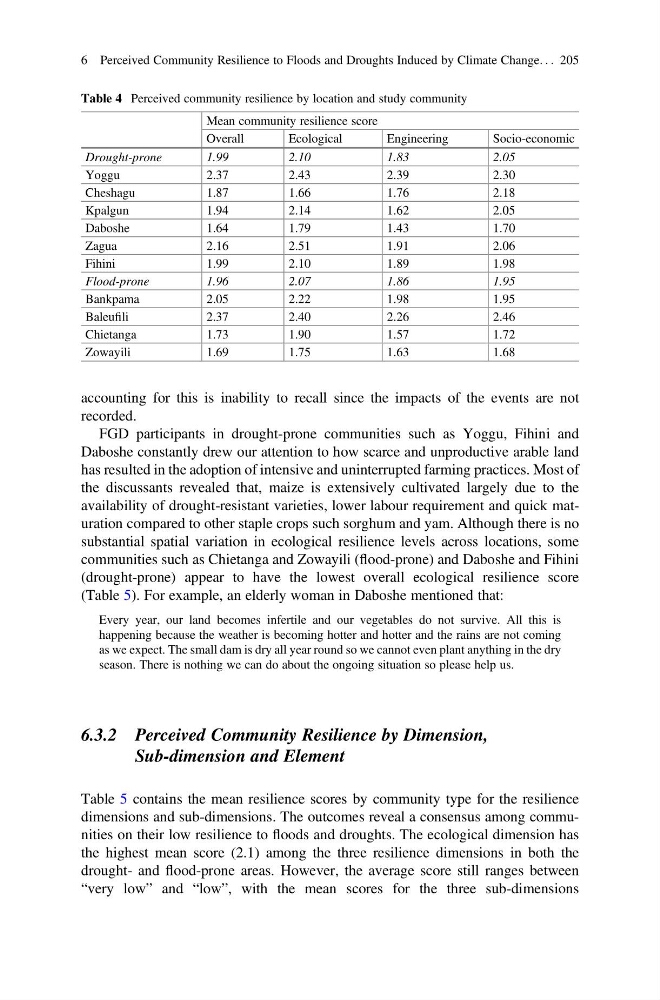
substantial spatial variation in ecological resilience levels across locations, some
communities such as Chietanga and Zowayili (flood-prone) and Daboshe and Fihini
(drought-prone) appear to have the lowest overall ecological resilience score
(Table 5). For example, an elderly woman in Daboshe mentioned that:
Every year, our land becomes infertile and our vegetables do not survive. All this is
happening because the weather is becoming hotter and hotter and the rains are not coming
as we expect. The small dam is dry all year round so we cannot even plant anything in the dry
season. There is nothing we can do about the ongoing situation so please help us.
6.3.2 Perceived Community Resilience by Dimension,
Sub-dimension and Element
Table 5 contains the mean resilience scores by community type for the resilience
dimensions and sub-dimensions. The outcomes reveal a consensus among communities on their low resilience to floods and droughts. The ecological dimension has
the highest mean score (2.1) among the three resilience dimensions in both the
drought- and flood-prone areas. However, the average score still ranges between
“very low” and “low”, with the mean scores for the three sub-dimensions
Table 4 Perceived community resilience by location and study community
Mean community resilience score
Overall
Ecological
Engineering
Socio-economic
Drought-prone
1.99
2.10
1.83
2.05
Yoggu
2.37
2.43
2.39
2.30
Cheshagu
1.87
1.66
1.76
2.18
Kpalgun
1.94
2.14
1.62
2.05
Daboshe
1.64
1.79
1.43
1.70
Zagua
2.16
2.51
1.91
2.06
Fihini
1.99
2.10
1.89
1.98
Flood-prone
1.96
2.07
1.86
1.95
Bankpama
2.05
2.22
1.98
1.95
Baleufili
2.37
2.40
2.26
2.46
Chietanga
1.73
1.90
1.57
1.72
Zowayili
1.69
1.75
1.63
1.68
6 Perceived Community Resilience to Floods and Droughts Induced by Climate Change. . . 205
recorded.
FGD participants in drought-prone communities such as Yoggu, Fihini and
Daboshe constantly drew our attention to how scarce and unproductive arable land
has resulted in the adoption of intensive and uninterrupted farming practices. Most of
the discussants revealed that, maize is extensively cultivated largely due to the
availability of drought-resistant varieties, lower labour requirement and quick maturation compared to other staple crops such sorghum and yam. Although there is no
substantial spatial variation in ecological resilience levels across locations, some
communities such as Chietanga and Zowayili (flood-prone) and Daboshe and Fihini
(drought-prone) appear to have the lowest overall ecological resilience score
(Table 5). For example, an elderly woman in Daboshe mentioned that:
Every year, our land becomes infertile and our vegetables do not survive. All this is
happening because the weather is becoming hotter and hotter and the rains are not coming
as we expect. The small dam is dry all year round so we cannot even plant anything in the dry
season. There is nothing we can do about the ongoing situation so please help us.
6.3.2 Perceived Community Resilience by Dimension,
Sub-dimension and Element
Table 5 contains the mean resilience scores by community type for the resilience
dimensions and sub-dimensions. The outcomes reveal a consensus among communities on their low resilience to floods and droughts. The ecological dimension has
the highest mean score (2.1) among the three resilience dimensions in both the
drought- and flood-prone areas. However, the average score still ranges between
“very low” and “low”, with the mean scores for the three sub-dimensions
Table 4 Perceived community resilience by location and study community
Mean community resilience score
Overall
Ecological
Engineering
Socio-economic
Drought-prone
1.99
2.10
1.83
2.05
Yoggu
2.37
2.43
2.39
2.30
Cheshagu
1.87
1.66
1.76
2.18
Kpalgun
1.94
2.14
1.62
2.05
Daboshe
1.64
1.79
1.43
1.70
Zagua
2.16
2.51
1.91
2.06
Fihini
1.99
2.10
1.89
1.98
Flood-prone
1.96
2.07
1.86
1.95
Bankpama
2.05
2.22
1.98
1.95
Baleufili
2.37
2.40
2.26
2.46
Chietanga
1.73
1.90
1.57
1.72
Zowayili
1.69
1.75
1.63
1.68
6 Perceived Community Resilience to Floods and Droughts Induced by Climate Change. . . 205